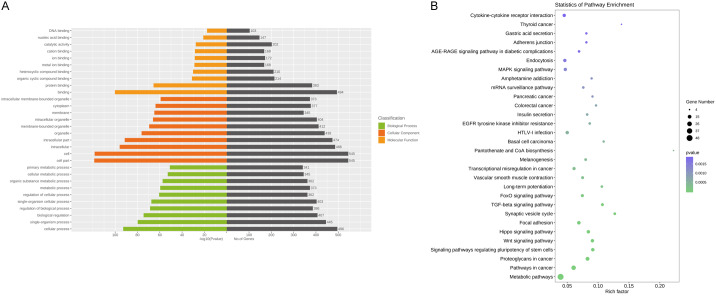
Figure 5.
Functional and pathway enrichment analysis of the different miRNA co-expression genes in SLE and SLE-SONFH group. A. Based on enrichment score, GO terms were divided into biological process, cellular component and molecular function. Bar graph displayed GO enrichment results with candidate gene numbers. B. Scatterplot of enriched KEGG pathway showing statistics of pathway enrichment.

