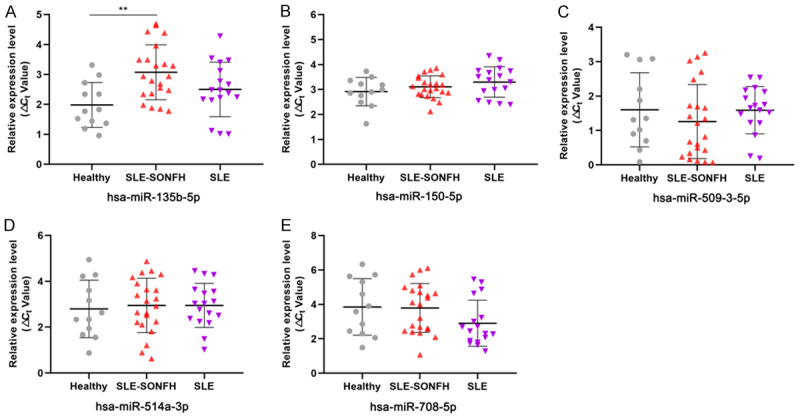
Figure 8.

qRT-PCR validation of the expression levels of five differentially expressed miRNAs in the healthy, SLE-SONFH and SLE groups. A. Hsa-miR-135b-5p was significantly up-regulated in SLE-SONFH patients compared to healthy controls (P < 0.05). B. Expression of hsa-miR-150-5p in the healthy, SLE group and SLE-SONFH groups. C. Expression of hsa-miR-509-3-5p in the healthy, SLE grouo and SLE-SONFH groups. D. Expression of hsa-miR-514a-3p in the healthy, SLE group and SLE-SONFH groups. E. Expression of hsa-miR-708-5p in the healthy, SLE group and SLE-SONFH groups.
