
Figure 1.
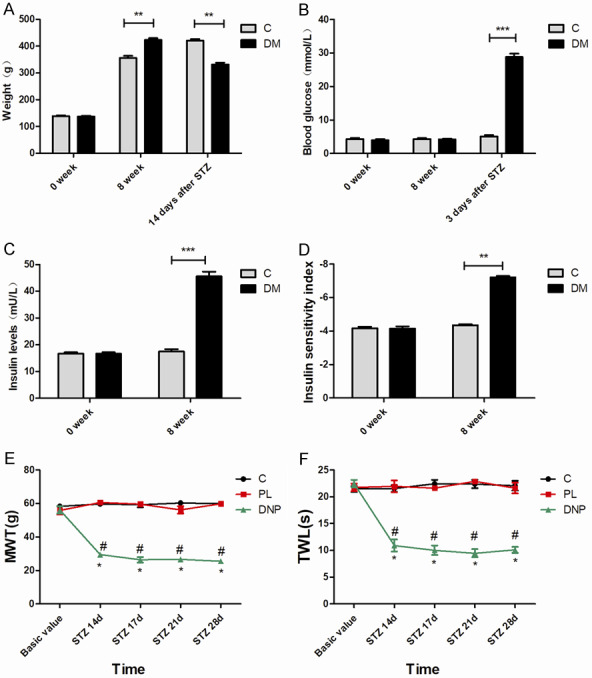
The validation of diabetic neuropathic pain rat models. A. Body weight in the C group and DM group at zero weeks and eight weeks. B. The time course of blood glucose level changes in rats in the C group and DM group. C. Insulin levels of diabetic rats at zero weeks and eight weeks. D. The time course of insulin sensitivity index changes in diabetic rats and rats in the control group. E, F. The mechanical allodynia and thermal hyperalgesia of rats were measured at eight weeks and on day 14, 17, 21 and 28 after STZ injection; n=6. *P<0.05, compared with the control group at the corresponding time point; #P<0.05, compared with the PL group at the corresponding time point.