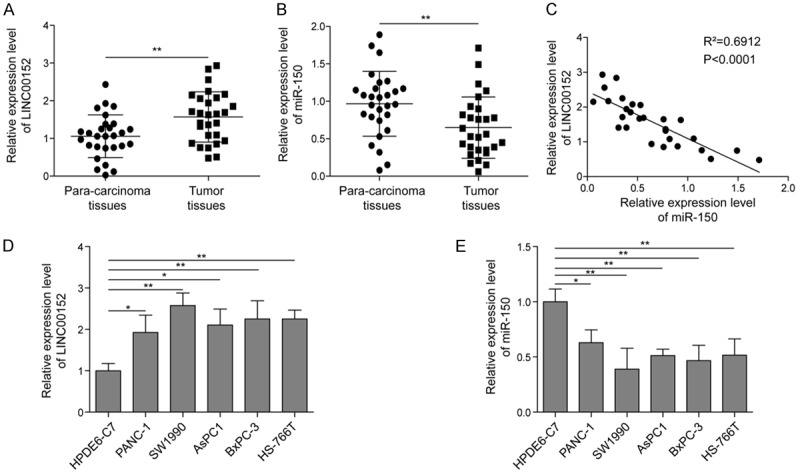
Figure 1.

Expression of LINC00152 and miR-150 in PC tissues and cell lines. A, B. The expression levels of LINC00152 and miR-150 in PC tissues (n=28) and adjacent normal tissues (n=28) by qRT-PCR assay. C. The Pearson correlation analysis between LINC00152 and miR-150 in PC tissues. D, E. The expression patterns of LINC00152 and miR-150 in five different PC cell lines, including BxPC3, Panc1, AsPC1, Sw1990, and HS-766T, as well as the normal pancreatic cell line HPDE6-C7 by qRT-PCR analysis. The mean ± SD in the graph presents the relative levels from three replications. *P < 0.05, **P < 0.01.
