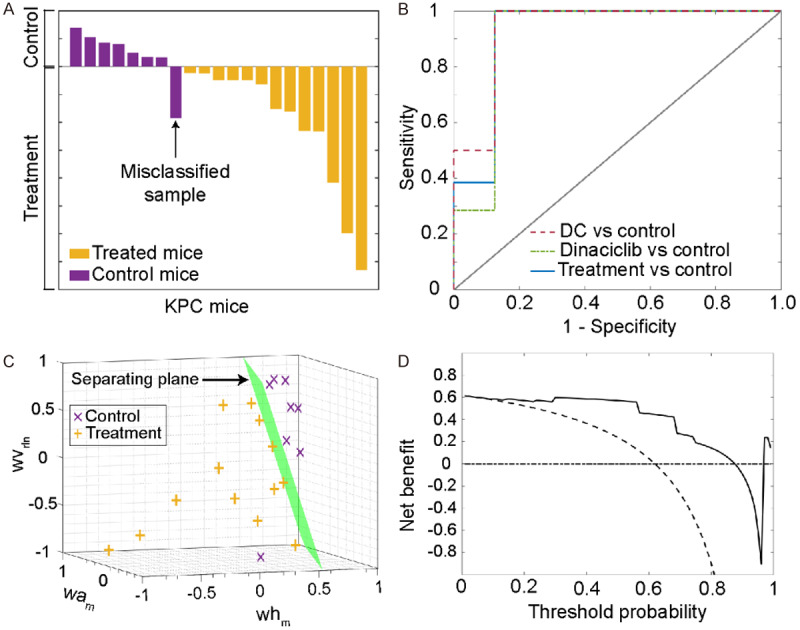
Figure 2.

The diagnostic performance of the generated classification model to detect changes in the tumor microenvironment. (A) represents posterior probabilities of each sample in control and treatment (dinaciclib and DC vaccine) groups that were computed with support vector machines classification model. Only one KPC mice used as untreated control subject was misclassified. The receiver operating curves (ROC) for the developed model are given in (B). The model was utilized to generate a ROC curve with different groups (DC vs. control, dinaciclib vs. control, Treatment (DC and dinaciclib vs. control). (C) visualizes the generated separation surface (green) to differentiate pancreatic tumors according to the status of treatment. (D) shows the benefit curve of the generated classification model according to decision curve plot analysis (solid line: prediction model, dashed line: assume all subjects are treated, dotted-dashed line: assume no subjects were treated). Abbreviations: wvrln: run-length nonuniformity of vertical wavelet coefficients; wam: mean of approximate wavelet coefficients; whm: mean of horizontal wavelet coefficients.
