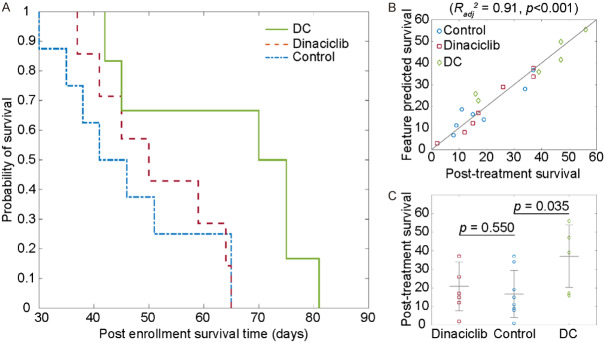
Figure 3.
Survival behavior and prediction analysis of the samples. Post enrolment survival behavior of the KPC mice was demonstrated with Kaplan-Meier plot (A). The prediction performance of the generated multivariable model for survival of the PDAC mice (B). The model had a strong correlation with observed survival behavior of KPC mice including untreated control and treated with DC vaccine or dinaciclib (Radj 2=0.91). The statistical assessment of post-treatment survival (C). The survival of KPC mice treated with DC vaccine had significantly longer (P=0.035) while there was no significant improvement for KPC mice treated with dinaciclib (P=0.55).

