
Figure 1.
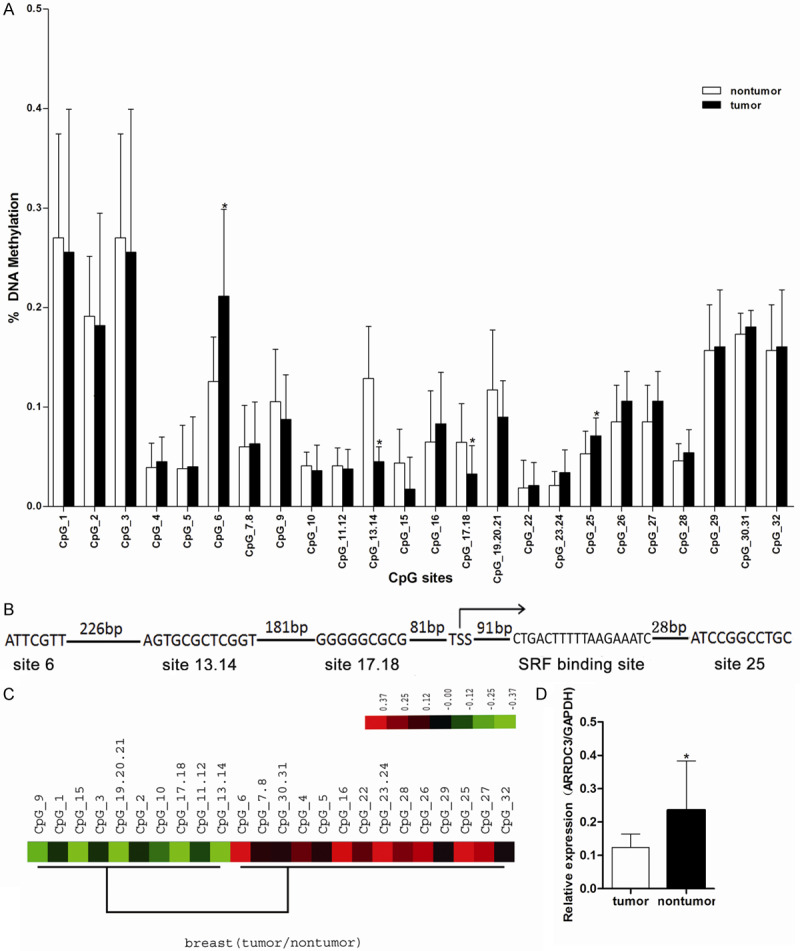
The methylation status of gene ARRDC3 promoter and its expression in breast cancer tissue. A. Comparison of mean methylation for each CpG site between nontumor and tumor. The X-axis represents 32 informative CpG sites within 5 MassArray amplicons for ARRDC3 promoter; the Y-axis shows the average methylation value of each CpG site (or clusters of CpG sites). Error bars = SD. Significant differences were indicated as *(P<0.05) by the t-test. The CpG_6, CpG_13.14, CpG_17.18, CpG_25 emerged with a significant difference between the notumor group and the tumor group. B. 5’ end of ARRDC3 gene, indicating the position of significant difference CpG sites, transcriptional start site from the UC Santa Cruz Genome Browser shown with bent right arrows and transcription factor SRF binding site. C. The hierarchical cluster analysis of methylation patterns of 32 CpG sites measured on 17 samples. The methylation level (subtracting the general mean value) of each CpG site within each sample is presented in the plot with color ranging from green (indicating low methylation) to red (indicating high methylation). The high methylation region was found to be mainly centralized around the CpG_25 site (from CpG_22 to CpG_29). D. Relative mRNA expression level of ARRDC3 in tumor or non-tumor tissue detected by real-time quantitative RT-PCR (*P<0.05). The tumor tissue showed the lower ARRDC3 level related to that in the normal tissue. The statistics were performed with the t-test.