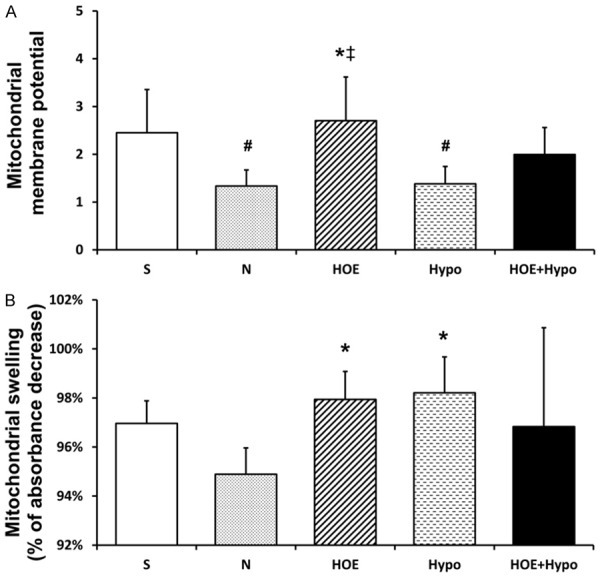
Figure 4.

Mitochondrial membrane potential and swelling at 24 h after resuscitation. A. Mitochondrial membrane potential was expressed by the fluorescence intensity ratio of JC-1 aggregation and monomer, n = 4-5/group; B. Mitochondrial swelling, n = 3-5/group. *P<0.05, vs. N groups; ‡P<0.05, vs. Hypo group; #P<0.05, vs. S group. S, sham; N, normothermia; HOE, HOE-642; Hypo, hypothermia; HOE+Hypo, HOE-642 plus mild hypothermia.
