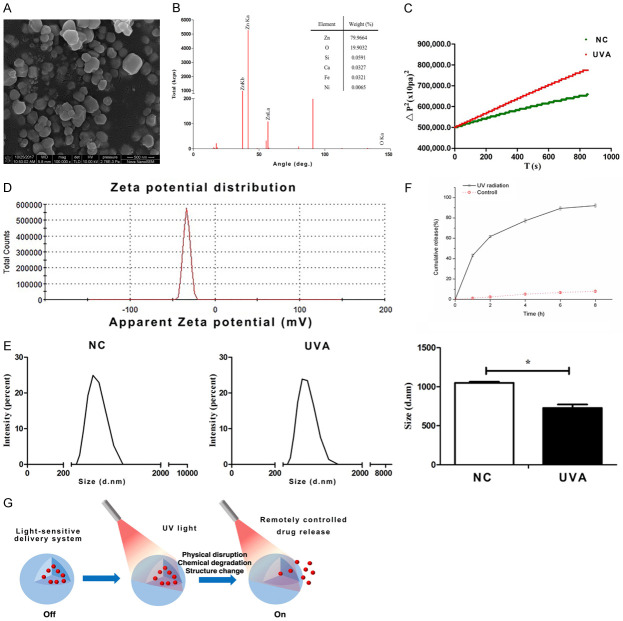
Figure 2.
UVA-controlled ZnO DDS. A. SEM-image of ZnO-NPs. B. Analysis of element composition by FTIR. C. The contact angle of ZnO. D. Zeta potential distribution of ZnO. E. The diameter of ZnO-NPs. F. The UV-controlled release behavior of AKBA. G. The schematic of the UVA-sensitive drug release system.

