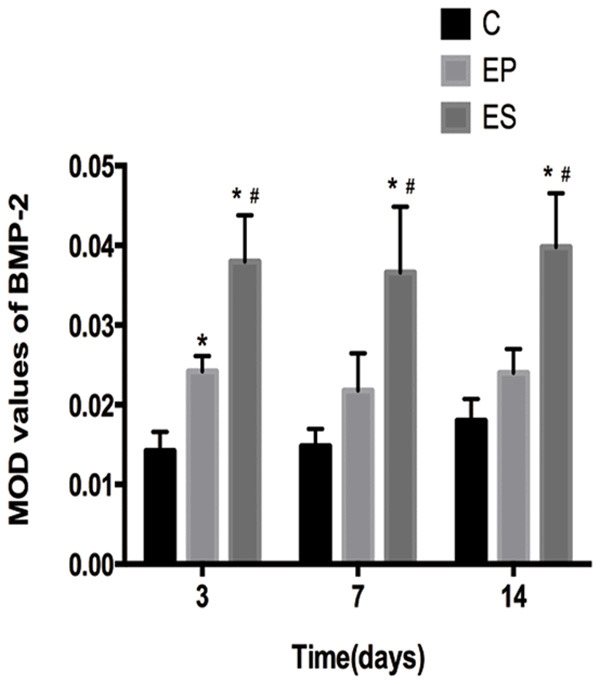
Figure 7.

The MOD values of BMP-2 in the mid-palatal suture of the three groups on days 3, 7, 14. *P<0.05, significant increase versus the C group. #P<0.05, significant increase versus the EP group. Data represent the mean ± SD of five rats for each group. C, control group; EP, expansion group; ES, expansion plus simvastatin group. MOD, mean optical density.
