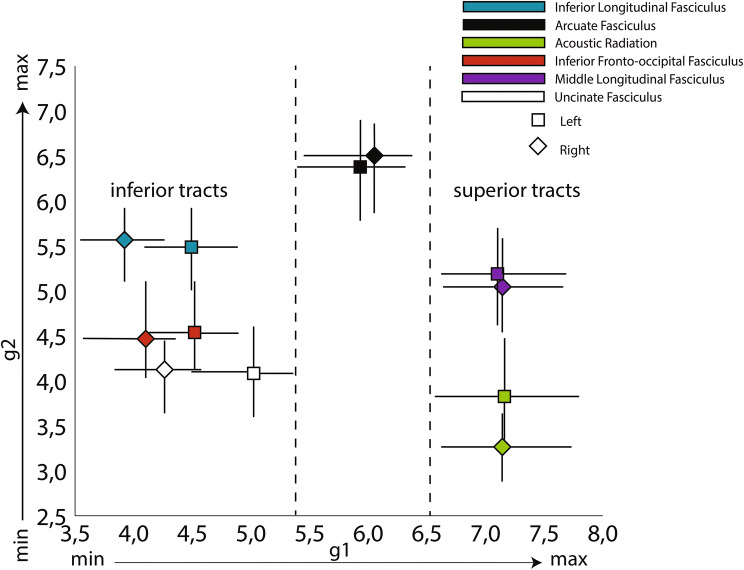
Fig. 3.
Projection image. Squares (left hemisphere) and diamonds (right hemisphere) represent average values of the temporal lobe’s relevant tract projections along the first two gradients. Dashes represent the bootstrapped 95% confidence interval of the mean. X-axis—value along the projection image of the first mode of connectivity (g1; from interior to superior positions); Y-axis—value along the projection image of the second mode of connectivity (g2; radiates from the AF).

