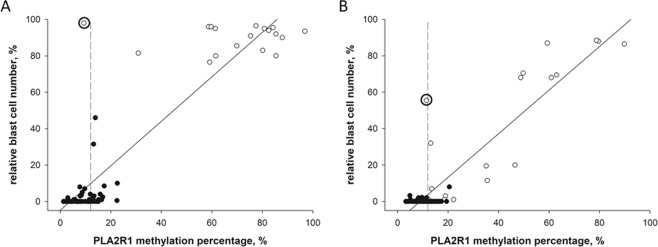
Figure 3.
Linear correlations between PLA2R1 promoter methylation and blast cell occurrence measured at the time of diagnosis and during childhood ALL treatment protocol. The scatter blots show the relative blast cell numbers plotted against the PLA2R1 methylation percentages determined in BM aspirates (A) and PB samples (B) at the time of diagnosis (white dots) and following ALL treatment protocol (black dots). The percentage of PLA2R1 promoter methylation was defined using ddPCR. The relative blast cell number (number of blast cells in relation to the number of total leukocytes in %) was determined using light microscopic and flow cytometric analyses. Significant positive correlations between the relative blast cell number and the PLA2R1 methylation percentage were detected for BM aspirates (r = 0.92, p < 0.001, n = 98) and PB samples (r = 0.91, p < 0.001, n = 98). The patient with high relative blast cell numbers and low PLA2R1 promoter methylation at diagnosis is indicated by bold circles for BM and PB samples. Dashed lines indicate the 97.5th percentile of the PLA2R1 promoter methylation in the healthy control group.

