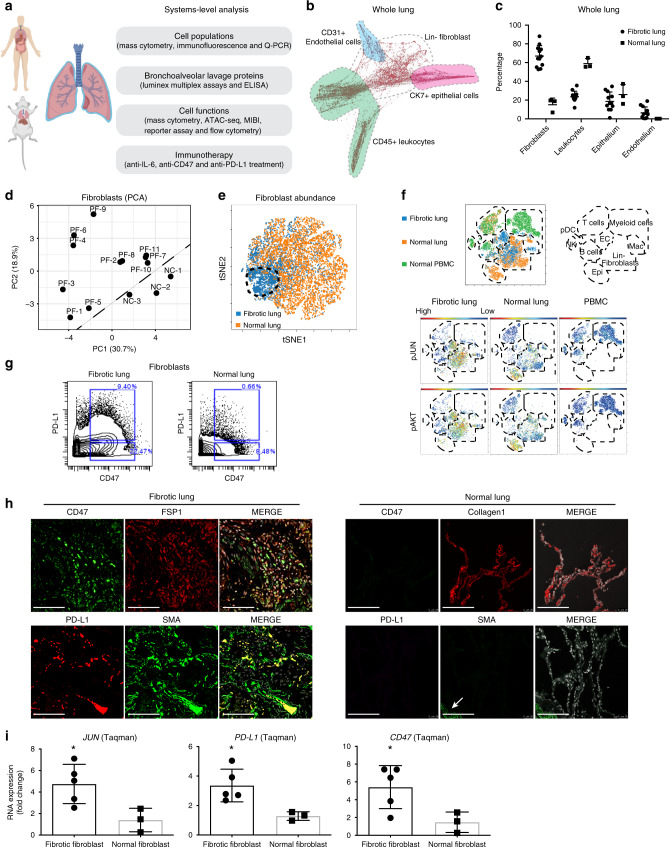
Fig. 1. Systems-level analysis of pulmonary fibrosis patients.
a Outline of our “Omics” approach in human fibrotic lung integrating proteomics, secretomics and genomics technology platforms to study the contribution of leukocytes and pathologic fibroblasts and to identify therapeutic targets. b Single-cell force-directed layout of fibrotic lung tissues. Shaded regions indicate the location of manually gated cell populations. c Frequencies of cell populations in the lung detected by mass cytometry (CyTOF). Data are displayed as mean ± SD of 11 fibrotic and 3 normal control-lung samples. d PCA was computed on fibroblast clusters from 11 individual pulmonary fibrosis patients (PF) and 3 normal donors (NC) mass cytometry datasets demonstrating that fibrotic and the normal fibroblasts were distinct from each other. e ViSNE maps of fibroblast mass cytometry data demonstrating that the abundance of fibroblasts differed. The data demonstrate a representative example per group and each point in the viSNE map represents an individual cell. f ViSNE analysis of mass cytometry data of fibrotic lung, normal lung and normal PBMCs revealed increased activation of the JUN and AKT pathways in fibrotic lung fibroblasts. Schematic diagram of the location of the indicated cell types on the viSNE map are based on the expression of lineage specific markers. Red indicates high and blue low protein expression. g Representative mass cytometry plots of the pro-fibrotic fibroblast population in fibrotic lung compared with normal lung. h Immune fluorescent stains confirmed increased CD47 and PD-L1 co-expression in lung fibroblasts from fibrotic lungs but not in normal controls (activated fibroblasts expressing FSP1+Collagen1+ and SMA+). The arrow indicates the blood vessel. (Scale bars, 100 μm). i RNA expression analysis of JUN, PD-L1 and CD47 in fibrotic and normal lung fibroblasts are detected by Taqman assay. Data are expressed as mean ± SD of 5 fibrotic fibroblasts and 3 normal fibroblasts and representative of at least three experiments. Data were analyzed by two-tailed unpaired t-test, *P < 0.05; **P < 0.01. See Supplementary Data 2 for statistical details. Source data are provided as a Source Data file.

