Figure 2.
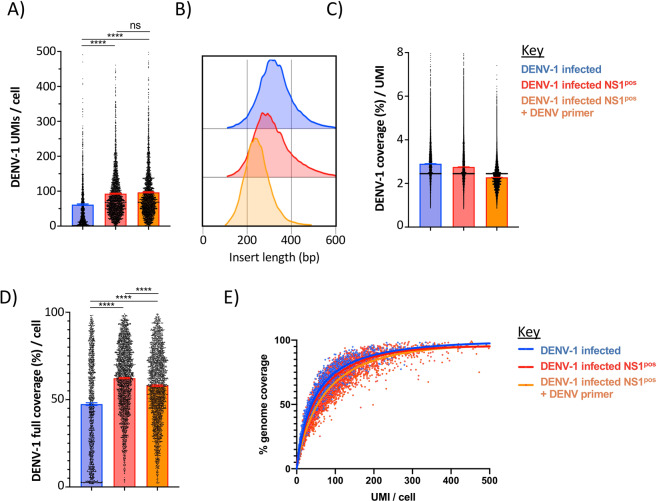
Characteristics of DENV-1 mapped transcripts identified by 5′ capture scRNAseq. (A) Number of unique DENV-1 mapped transcripts identified per cell in DENV-1 infected DC-SIGN expressing CEM.NKR cell cultures (blue), DENV-1 infected sorted NS1pos cultures (red), and DENV-1 infected sorted NS1 pos cultures supplemented with a DENV-specific cDNA synthesis primer during scRNAseq analysis (orange). (B) DENV-1 mapped insert lengths identified by scRNAseq analysis. (C) Median DENV-1 genome coverage obtained per UMI in 5′ capture scRNAseq analysis. (D) DENV-1 genome coverage achieved per cell by 5’ capture scRNAseq. Only cells with > =1 DENV-1 mapped UMIs are shown. (E) Relationship between DENV-1 UMI recovery and DENV-1 genome coverage achieved by 5′ capture scRNAseq. Curves calculated by non-linear regression (single variable). **** p < 0.0001, one-way ANOVA.

