Figure 3.
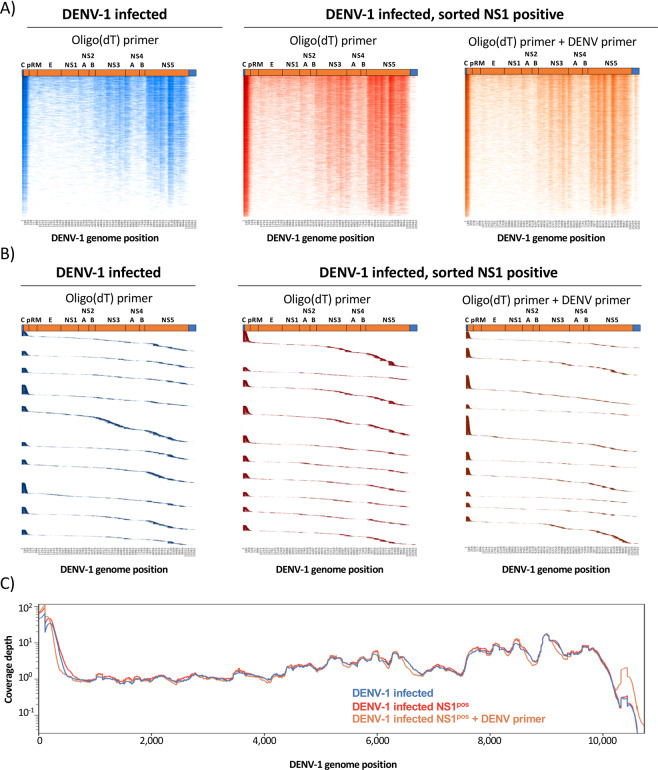
Genome coverage of positive-sense DENV-1 mapped transcripts identified by 5′ capture scRNAseq. (A) Heatmap representation of positive-sense DENV-1 genomic sequence recovery in individual cells analyzed by 5′ capture scRNAseq from DENV-1 infected cultures (blue), DENV-1 infected sorted NS1pos cultures (red), and DENV-1 infected sorted NS1pos cultures supplemented with a DENV-specific cDNA synthesis primer (orange). Color intensity indicates sequence coverage/depth at that genomic location, vertical axis contains a single cell per line. Cells are ranked by total DENV-1 genomic coverage. Cells with > =1 DENV-1 mapped UMI are included in the visualization. (B) Positive-sense DENV-1 genomic localization of individual UMIs obtained from the top 10 cells in each analysis condition with the most DENV-1 coverage as assessed by 5′ capture scRNAseq analysis. UMIs are ranked by genomic location 5′ to 3′, and the vertical axis contains a single DENV-1 mapped UMI per line. (C) Aggregated positive-sense DENV-1 genomic coverage and sequence depth of all in vitro infected samples as assessed by 5′ capture scRNAseq.

