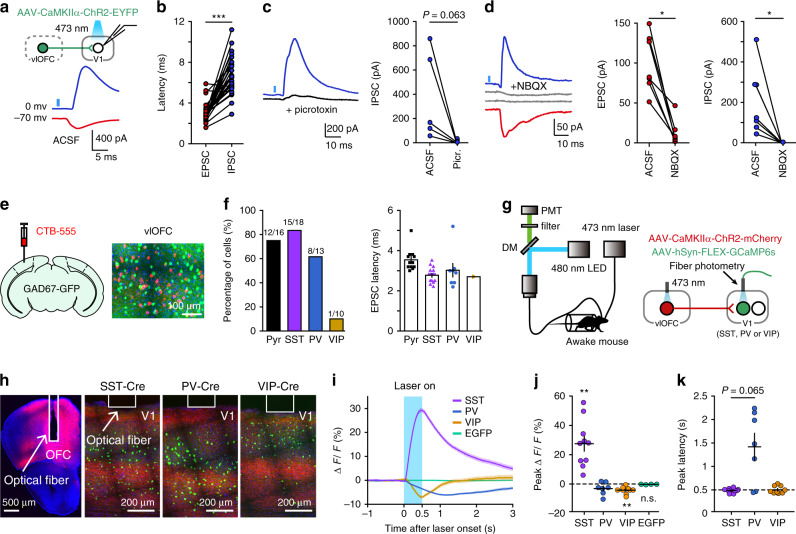
Fig. 2. Activating OFC axons activates V1 inhibitory interneurons.
a Photostimulation of OFC projection to V1 evoked both EPSCs (red) and IPSCs (blue) in a V1 neuron. b The EPSC latencies vs IPSC latencies (***P = 2.34 × 10⁻⁶, n = 30, in which n = 7, 12, 1, 1, and 9 for pyramidal, SST, PV, VIP, and unidentified neurons, respectively). c Left, GABAA receptor antagonist (picrotoxin, 30 μM) application blocked IPSCs in a V1 neuron. Black, IPSCs after picrotoxin application. Right, IPSCs amplitudes before and after picrotoxin application (P = 0.063, n = 5). d Left, AMPA receptor antagonist (NBQX, 10 μM) application blocked both EPSCs and IPSCs in a V1 neuron. Gray, EPSCs and IPSCs after NBQX application. Middle and right, EPSCs (IPSCs) amplitudes before and after NBQX application (P = 0.016 and n = 7 neurons for both EPSCs and IPSCs). e CTB was injected in V1 of a GAD67-GFP mouse. Retrograde labeling of OFC neurons did not overlap with GFP-positive OFC neurons. f Left, fraction of pyramidal (Pyr) and inhibitory interneurons showing laser-evoked EPSCs. Right, EPSC latency for each type of neuron. g Schematic of the strategy to record activities of specific interneuron type in V1 evoked by OFC activation. h Fluorescence image of OFC in which AAV-CaMKIIα-ChR2-mCherry was injected, and those of V1 injected with AAV-hSyn-FLEX-GCaMP6s from a SST-Cre, PV-Cre, and VIP-Cre mouse, respectively. White rectangles, placement of the optic fiber. The results were replicated >6 times. i Representative ΔF/F signals from a SST-Cre, PV-Cre, VIP-Cre mouse, and a C57BL/6 mouse (AAV-hSyn-EGFP injected in V1), respectively. Blue, OFC stimulation. j Amplitude of peak ΔF/F. SST: **P = 0.002, n = 10 mice; PV: P = 0.078, n = 7 mice; VIP: **P = 0.004, n = 9 mice; EGFP: P = 0.13, n = 4 mice. k Latency of peak ΔF/F. SST vs PV: P = 0.065 (Wilcoxon two-sided rank sum test). Wilcoxon two-sided signed rank test for b, c, d, j. For b−d, f, and i–k, source data are provided as a Source Data file. Shadings and error bars, mean ± s.e.m.

