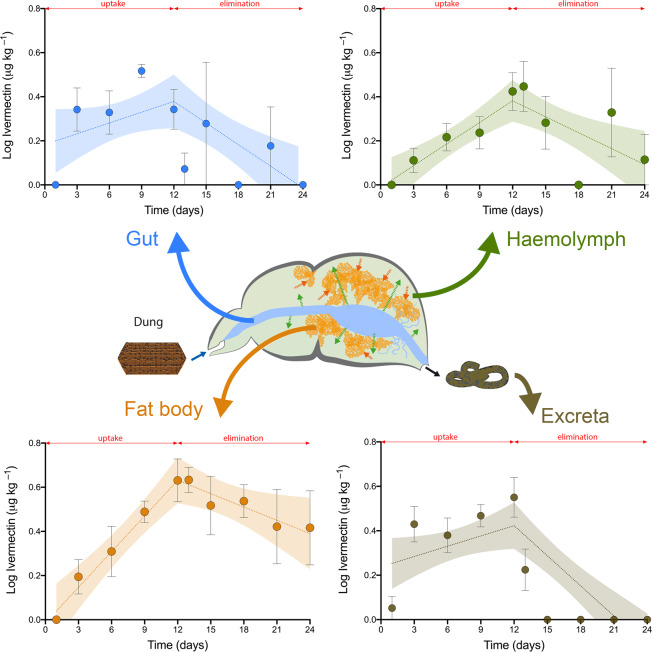
Figure 1.
Toxicokinetic curves for ivermectin concentrations in the different biological matrices of Thorectes lusitanicus. The red arrow indicates the time that separates the phases of uptake and elimination. Shaded areas represent the 95% confidence intervals of each model. Bars represent ± sem, n = 10 for each time period during the uptake phase; for the elimination phase, n varied according to the quantity necessary for sample preparation in the extraction protocol (gut: n = 3; haemolymph: n = 6; fat body: n = 6; excreta: n = 5).

