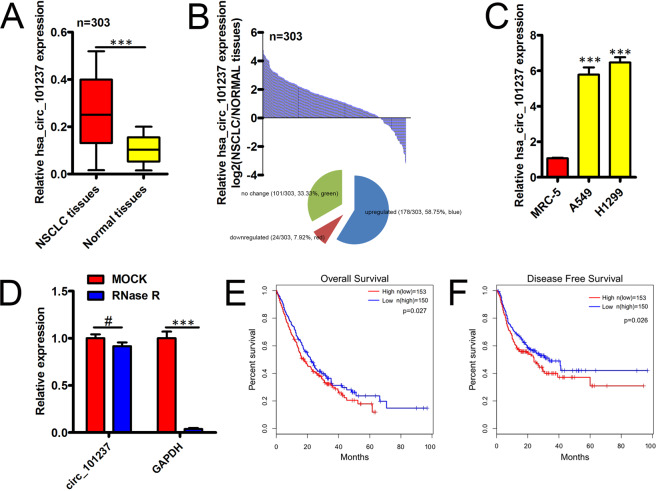
Figure 1.
hsa_circ_101237 expression in NSCLC tissues and cell lines, and its clinical significance. (A) Determination of hsa_circ_101237 expression in 303 paired samples of the NSCLC tissues. (B) Proportion pie chart and histogram of NSCLC sample that saw the up-regulation of hsa_circ_101237 expression (242/303, 79.87%, red), down-regulation (33/303, 10.89%, blue), or no change (28/303, 9.24%, brown). Expression value of Log2 (T/N) > 1 and < −1 were regarded as as higher and lower expression, respectively, and that in the range of −1–1 was regarded as no obvious change. (C) Based on the qRT-PCR analysis on hsa_circ_101237 expression, hsa_circ_101237 presented up-regulation in NSCLC cells. (D) qRT-PCR helped to determine hsa_circ_101237 expression after RNase R treatment in A549 cell line. (E,F) The prognosis presented by NSCLC patients whose hsa_circ_101237 levels were different was assessed via Kaplan–Meier survival analysis. The cutoff value referred to median hsa_circ_101237 expression level in those NSCLC tissues. *P < 0.05; **P < 0.01; ***P < 0.001.

