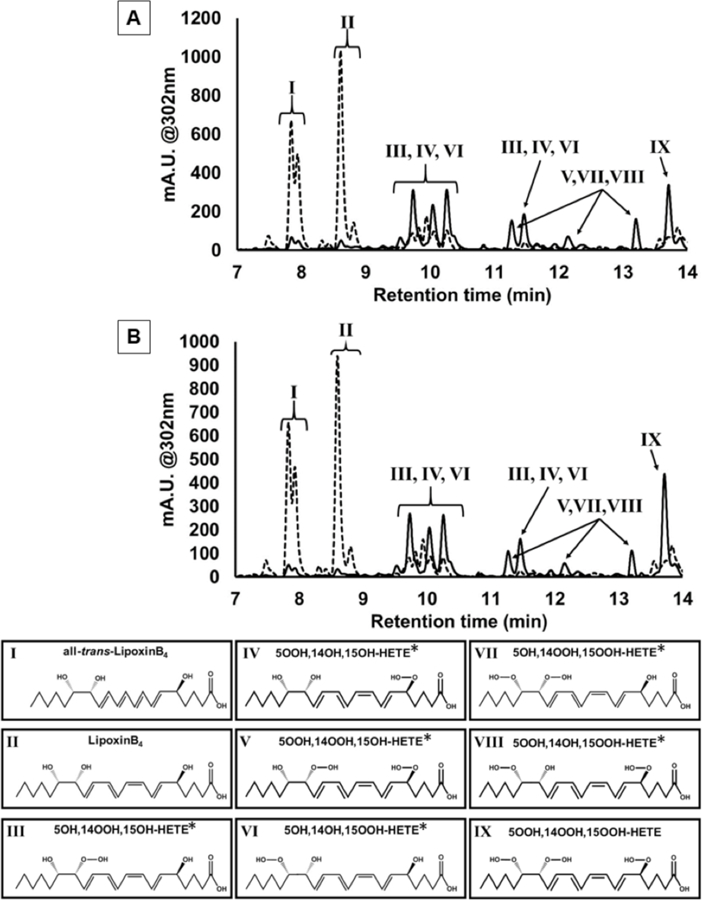
Figure 2: UPLC-UV-Vis chromatogram of h12-LOX (A) and h15-LOX-1 (B) products from 5,15-diHpETE.

The wavelength of 302 nm is the absorbance maximum for lipoxins (Supplemental S1). At 302 nm, 11 peaks are observed in the unreduced (solid line) reaction that coalesce to 2 clusters of peaks upon reduction (dashed line). Based on the UV-Vis spectrum, retention times, parent masses, and MS/MS spectra (Supplemental S2), the identities of these peaks have been determined to be all-trans-LxB4 and its 14S-epimer at 7.9 min, LxB4 and its 14S-epimer at 8.6 min and 5,14,15-trihydroperoxy-LxB4 at 13.6 min. The peaks at 9.5, 9.8, 10.0, 10.3 and 11.5 min are the monohydroperoxide products and the peaks at 11.3, 12.2, and 13.2 min are the dihydroperoxide products. *Note: although only one double bond stereochemistry is depicted for these compounds, the differing retention times suggest rearrangements. MS/MS spectra contain fragments that indicate the hydroperoxide moiety’s position may differ between these mono- and dihydroperoxy-HETEs.
