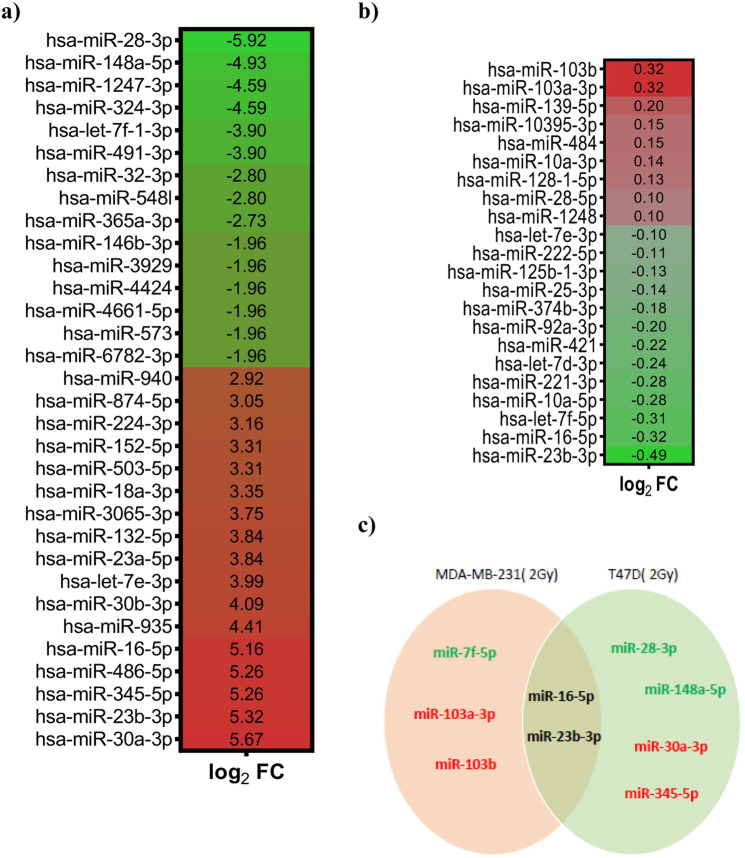
Figure 4.
Evaluation of miRNAs expression modified by irradiation in breast cancer cells. (a,b) Heat maps of the most differentially expressed miRNAs in T47D (a) and MDA-MB-231 (b) cells irradiated with 2 Gy dose and analyzed 24 hours after irradiation and compared to the miRNAs expression levels of the respective non-irradiated cells. (c) Venn diagram of the 5/6 most differentially expressed miRNAs in the two cell lines. In red are reported miRNAs overexpressed and in green those downregulated in irradiated cells. FC = Fold change.

