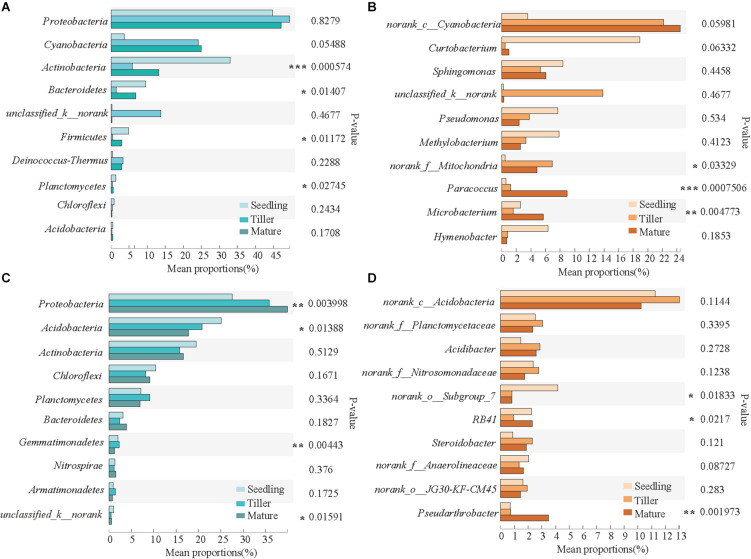
FIGURE 3.
Relative abundances of top 10 bacterial phyla and genera that showed significant differences among phyllosphere (A,B) and rhizosphere (C,D) samples from the seedling, tiller, and mature stages. A one-way ANOVA was used to evaluate the significance of differences between the indicated groups. *P < 0.05; **P < 0.01; and ***P < 0.001.

