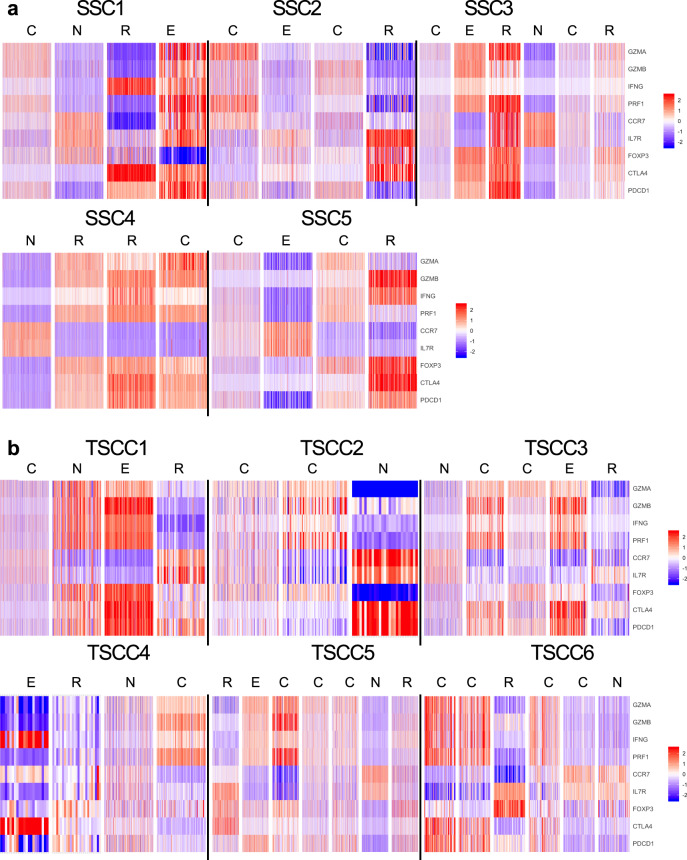
Fig. 2. RNA seq derived CD8+TIL phenotyping.
Heatmap plots of CD8+T cell RNA expression in SCC (a) and TSCC (b) tumors reveals distribution of T cell subpopulations. Red indicates increased expression, whereas blue indicates reduced expression. Upper panel shows SCC with naïve (N), cytotoxic (C), regulatory (R), and exhausted (E) subtypes of CD8+TIL. Lower panel shows heatmaps from TSCC with naïve (N), cytotoxic (C), regulatory (R), and exhausted (E).

