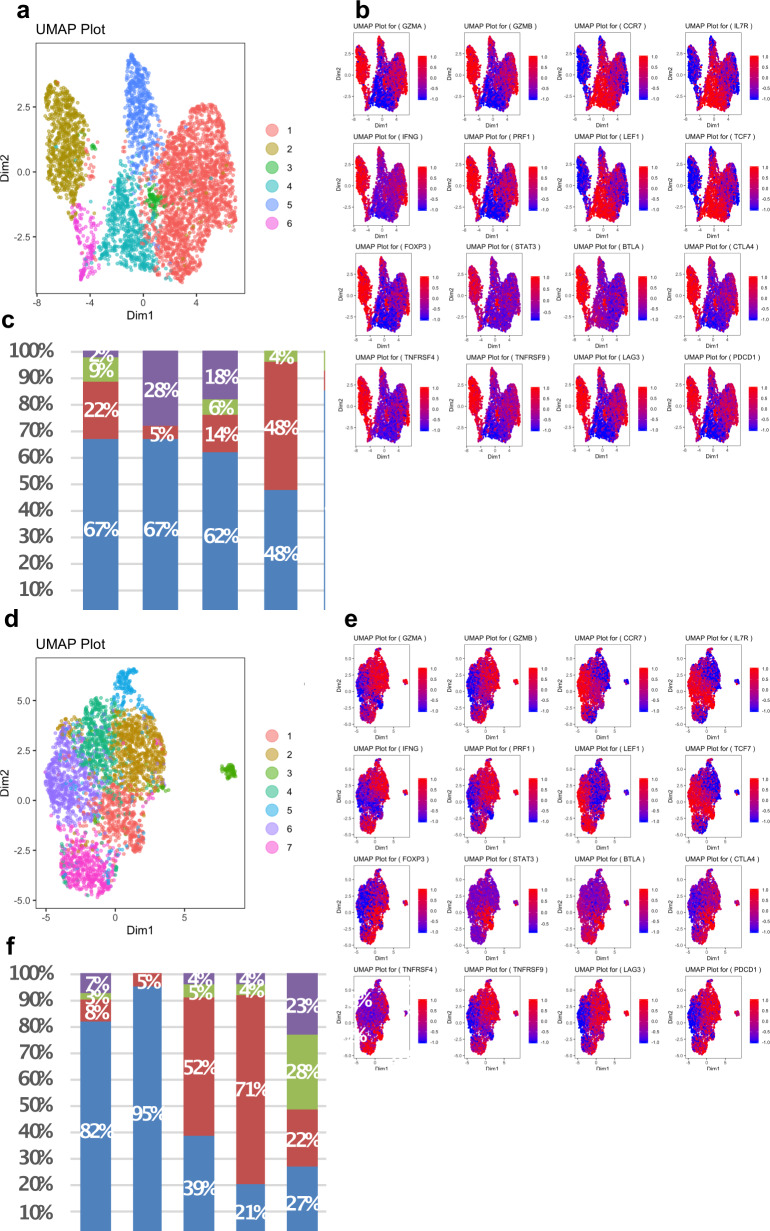
Fig. 3. UMAPs and gene expression heat maps for CD8+T lymphocytes from human SCC3 (upper panel) and TSCC5 (lower panel).
CD8+tumor infiltrating lymphocytes (n = 34,399) obtained from fresh SCC tumor specimens from five immunocompetent patients and CD8+TILs (n = 14,902) obtained from fresh TSCC tumor specimens from five immune suppressed transplant patients with six TSCCs were subject to single-cell RNA profiling linked with T-cell receptor (TCR) sequencing. Data were analyzed using iCellR, a custom R package we developed for single cell sequencing analysis. a, d T cells were clustered according to their top 500 gene expression levels by RNAseq. b, e Expression of characteristic T lymphocyte genes are shown (clockwise from top left) for cytotoxic, naïve, exhausted and regulatory markers. Red indicates increased expression, whereas blue indicates reduced expression. c, f Percent proportion of cytotoxic, naïve, regulatory, and exhausted T cell compartment for all tumors and mean of SCC and TSCC tumors.

