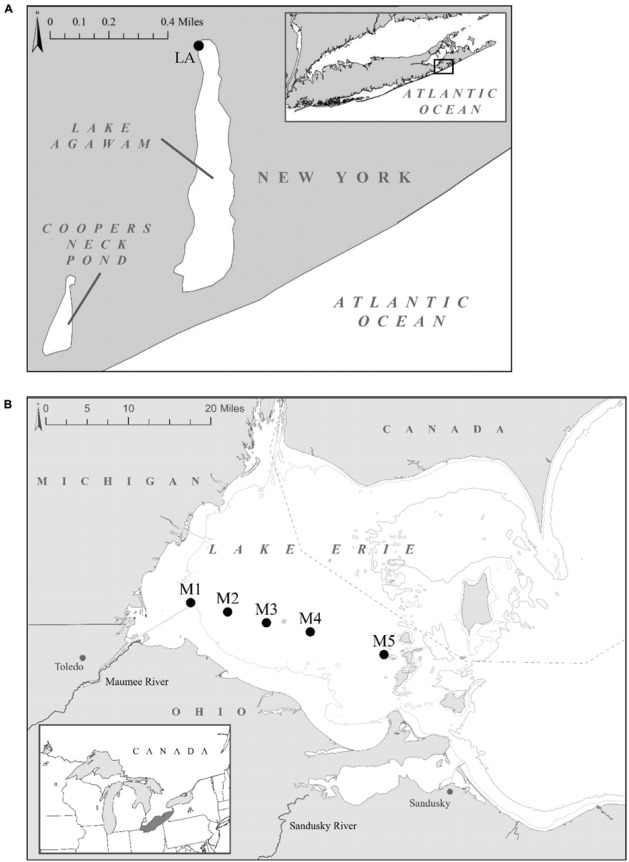
FIGURE 1.

Sampling locations: (A) Lake Agawam time series study site. (B) Lake Erie study sites located across the Maumee Bay region (M1–M5) in the western basin. The right insert displays Lake Erie’s location within the great lakes. NASA’s MODIS- Aqua data cyanobacterial Index composite images of the bloom extent and intensity on the sampling dates are available at https://www.glerl.noaa.gov/res/HABs_and_Hypoxia/lakeErieHABArchive/. GPS coordinates for sampling sites are listed in Supplementary Table 1.
