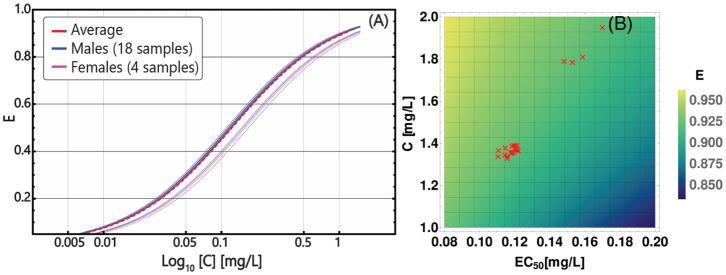
Figure 4.
Patient-specific PD models. (A) personalized PD curves obtained from Equation (10) by using Emax = 1 and n = 1 for all patients, and distinct values of EC50, based on the death rate of cancer stem cells, as estimated from longitudinal data on tumor burden; x axis (Log10 scale) describes the concentration in the range C ∈ [0, 1.2] [mg/L], on y axis the efficiency E is displayed. The solid blue curves correspond to the 18 distinct male patients included in the dataset and the solid pink curves correspond to the 4 distinct female patients and the dashed red curve represents the population-average pharmacodynamics. (B) Heat-map returning the variation of efficiency E, computed via Equation (10), with respect to distinct parameters of the PK model—i.e., patient-specific time-average concentration (y axis)—and of the PD model—i.e., patient-specific EC50 (x axis). Red triangles represent the 22 patients in the dataset.

