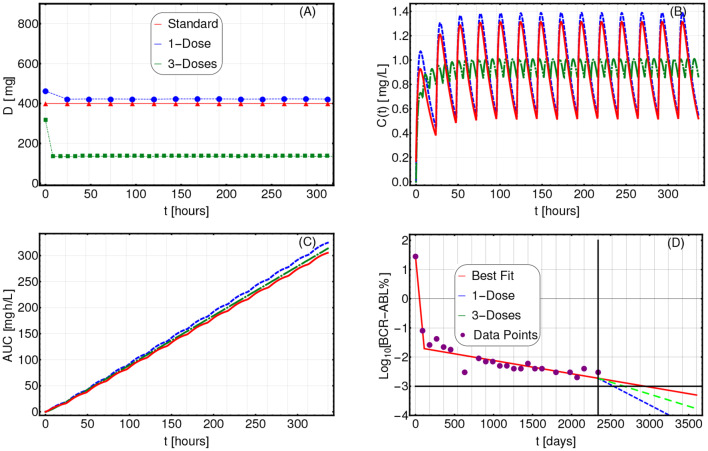
Figure 6.
Adjusting therapy for tumor burden minimization. Imatinib administration optimized for tumor burden minimization in patient 0001 00004 AJR (male) from Michor et al. (2005), in the cases of: 1-dose/day (purple) and 3-doses/day (green), with ϕ = 60, as compared to standard administration (red). In this case, the optimization is obtained on patient-specific PK and PD models. (A) Imatinib scheduled dosage in mg (y axis), displayed on 14 days (x axis). (B) Imatinib concentration in blood in [mg/L] (y axis). (C) Temporal variation of the AUC in [mg·h/L] (y axis). (D) Longitudinal data points on tumor burden recorded in the interval t ∈ [0, 2340] days (purple). The best fit is shown with red lines. The slope of the right-most line is used to determine the cancer stem cell death rate and, in turn, the patient-specific PD parameters. The blue (green) line represents the predicted cancer subpopulation decay in case the 1-dose (3-doses) optimized therapy was adopted from day 2, 340 to day 3, 500.

