
Figure 2.
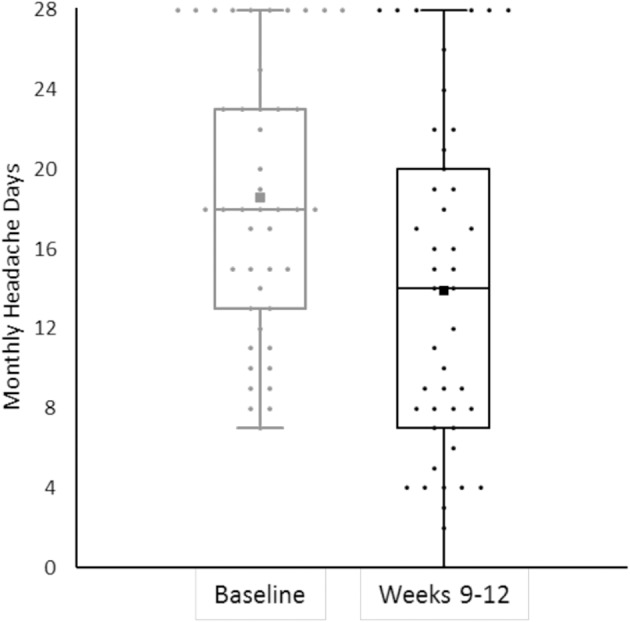
The bee swarm plot shows mean monthly headache days during the 4-week baseline and in erenumab treatment at weeks 9–12 (n = 45).
Official websites use .gov
A
.gov website belongs to an official
government organization in the United States.
Secure .gov websites use HTTPS
A lock (
) or https:// means you've safely
connected to the .gov website. Share sensitive
information only on official, secure websites.
The bee swarm plot shows mean monthly headache days during the 4-week baseline and in erenumab treatment at weeks 9–12 (n = 45).