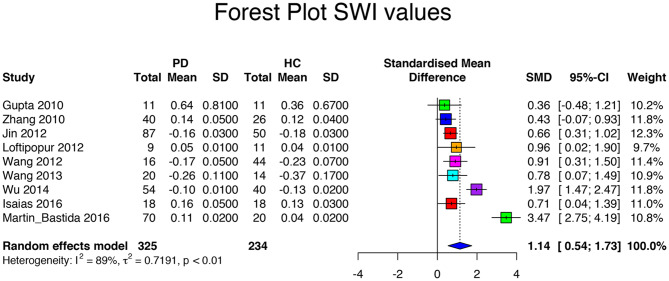
Figure 3.
Forest plot of significant SWI values of the 10 articles included in the meta-analysis. Forest plot of the computed disease effect sizes (Hedge's g, x-axis) of studies included into the meta-analysis on QSM measures of the substantia nigra when comparing PD patients and controls. Pooled SMD (95%) (1.14, [0.54, 1.73]) is denoted by a blue diamond.

