
Figure 2.
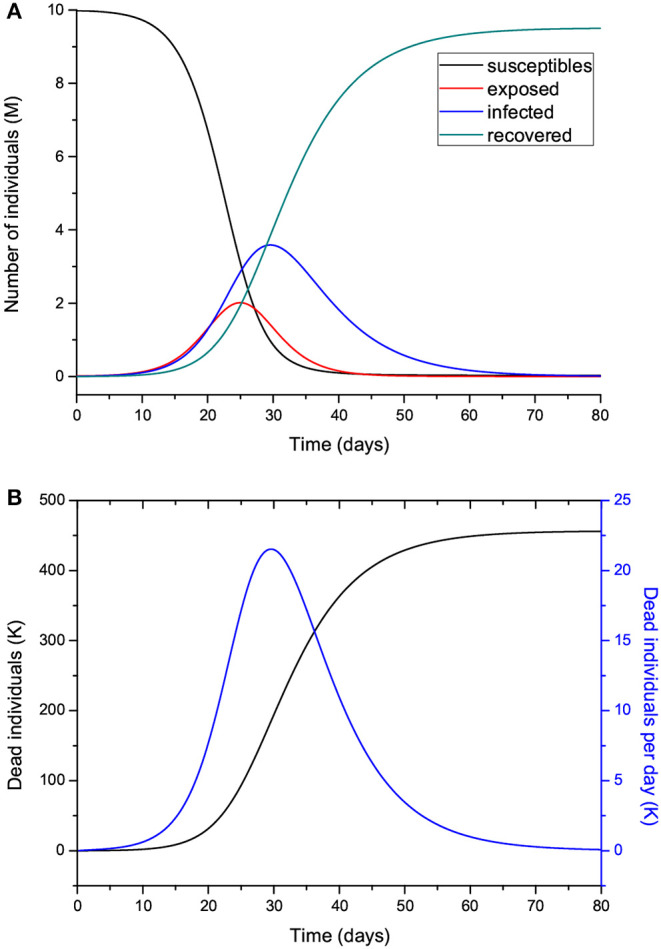
Number of individuals in the different classes (millions) (A), and total number of deaths and number of deaths per specific day (thousands) (B). The number of exposed people at t = 0 is 20,000, and there is one initially infected individual, I(0) = 1. The value of R0 = 5.72 means imperfect isolation measures.