
Figure 3.
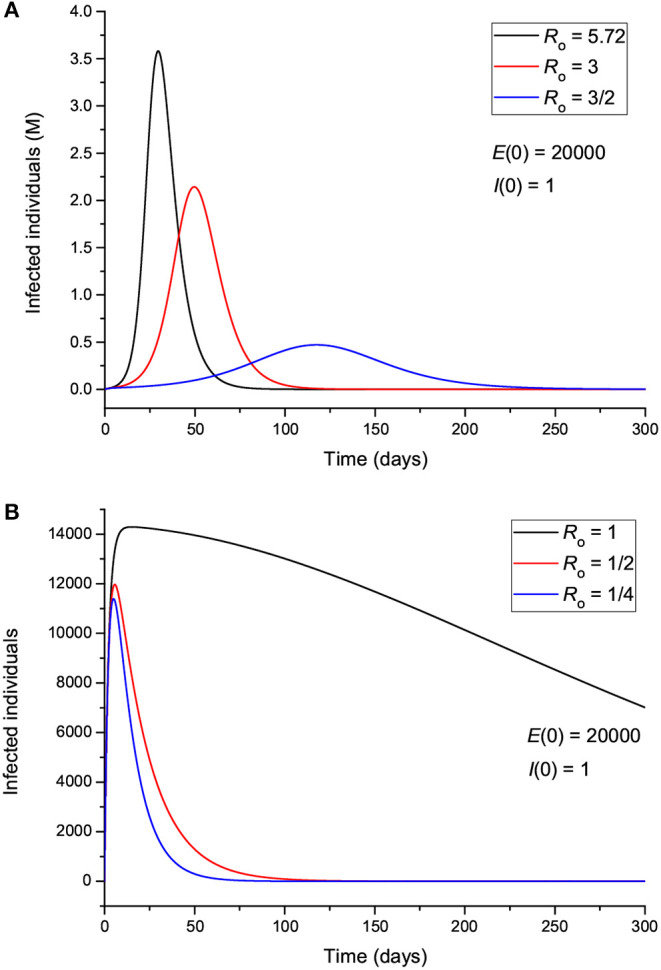
Number of infected individuals for different values of R0, corresponding to values greater (A) and less (B) than 1.
Official websites use .gov
A
.gov website belongs to an official
government organization in the United States.
Secure .gov websites use HTTPS
A lock (
) or https:// means you've safely
connected to the .gov website. Share sensitive
information only on official, secure websites.
Number of infected individuals for different values of R0, corresponding to values greater (A) and less (B) than 1.