
Fig. 3.
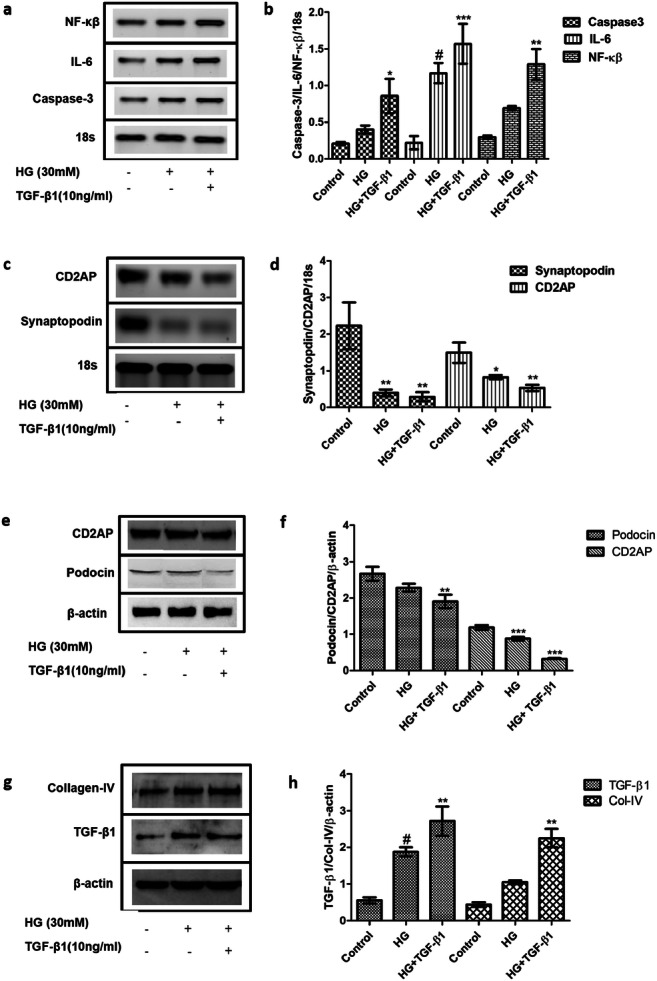
Confirmation of in-vitro DN model generation. a & b. RT-PCR analysis showed increased relative mRNA expression levels of IL-6, NF-κβ and Caspase3 in the HG and TGF-β1 treated group as compared to the control group. c & d. mRNA expression levels of Synaptopodin and CD2AP were decreased in the HG and TGF-β1 treated group as compared to the control group as per RT-PCR analysis. e & f. Relative protein expression levels of Podocin and CD2AP were decreased in the HG and TGF-β1 treated group as compared to the control group as per western blotting analysis. g & h. The expression levels of Collagen type-IV and TGF-β1 were increased in the high glucose and TGF- β1 treated group as compared to only high glucose treated group as per western blotting analysis. Data are expressed as the mean ± SD calculated from three experiments. * depicts P < 0.05, ** depicts P < 0.01, and *** depicts P < 0.001 in comparison to the control group. HG, High Glucose; TGF-β1, Transforming growth factor- β1; NF- κβ, Nuclear factor- κβ; TNF-α, Tumor necrosis factor- α; CD2AP, CD2 associated protein; IL-6, Interleukin-6 (n = 3)