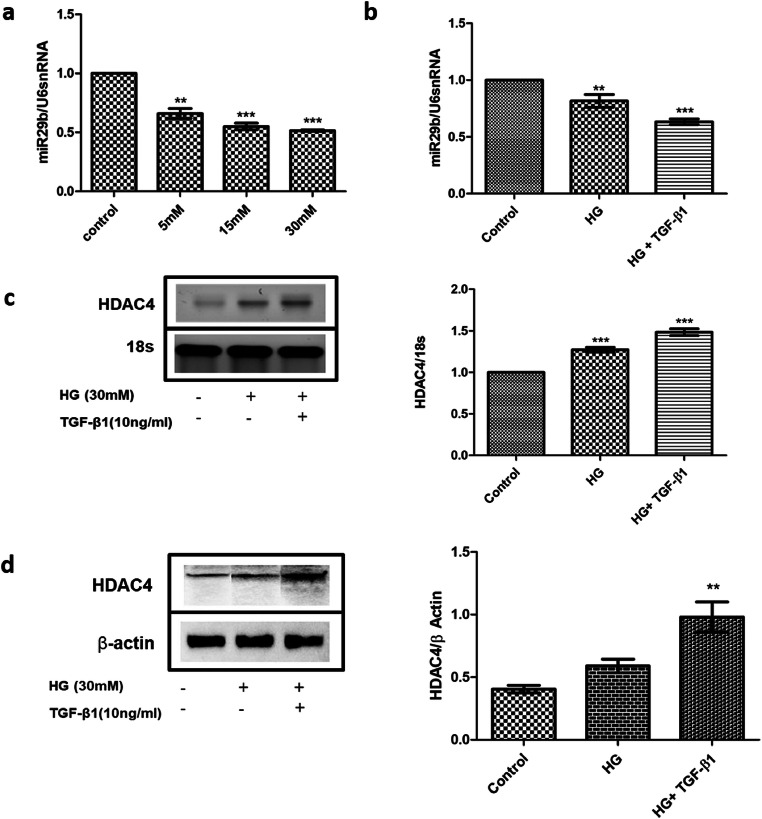
Fig. 4.
Effect of HG and TGF-β1 on the expression of miR-29b and HDAC4. a. miR-29b expression was significantly downregulated in glucose concentration of 5 mM, 15 mM and 30 mM in a dose dependent manner. b. Relative miR-29b expression levels were decreased in the HG and TGF-β1 treated group when compared to the control group as per quantitative real-time PCR analysis. c. Relative mRNA expression levels of HDAC4 were increased in the HG and TGF-β1 treated group as per real-time PCR analysis. d. Relative protein expression patterns of HDAC4 were increased in the HG and TGF-β1 treated group as per western blotting analysis. Data are expressed as the mean ± SD calculated from three experiments. ** depicts P < 0.01 and *** depicts P < 0.001 in comparison to the control group. HG, high glucose; TGF-β1, Transforming growth factor- β1 (n = 3)

