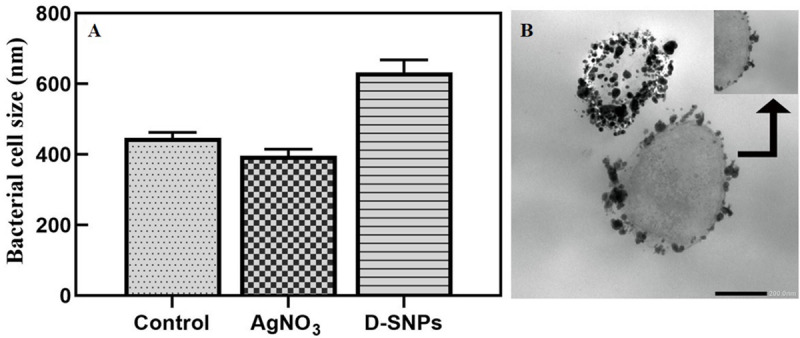
FIGURE 5.

(A) MRSA cell size after treating with silver nitrate and D-SNPs. (B) TEM image showing the D-SNPs attached on MRSA cell wall. Scale bar, 200 nm.

(A) MRSA cell size after treating with silver nitrate and D-SNPs. (B) TEM image showing the D-SNPs attached on MRSA cell wall. Scale bar, 200 nm.