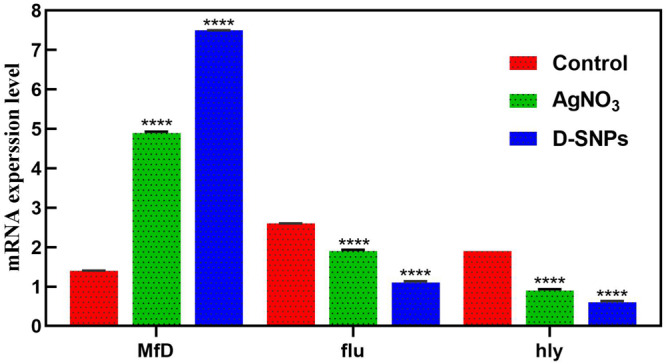
FIGURE 7.

mRNA expression level of mfD, flu, hly genes of MRSA before and after treatment with AgNO3 or D-SNPs. Data from at least three independent experiments performed at least in triplicate are presented as the mean ± SEM; P-values were calculated versus untreated bacterial cells: ****P < 0.00001.
