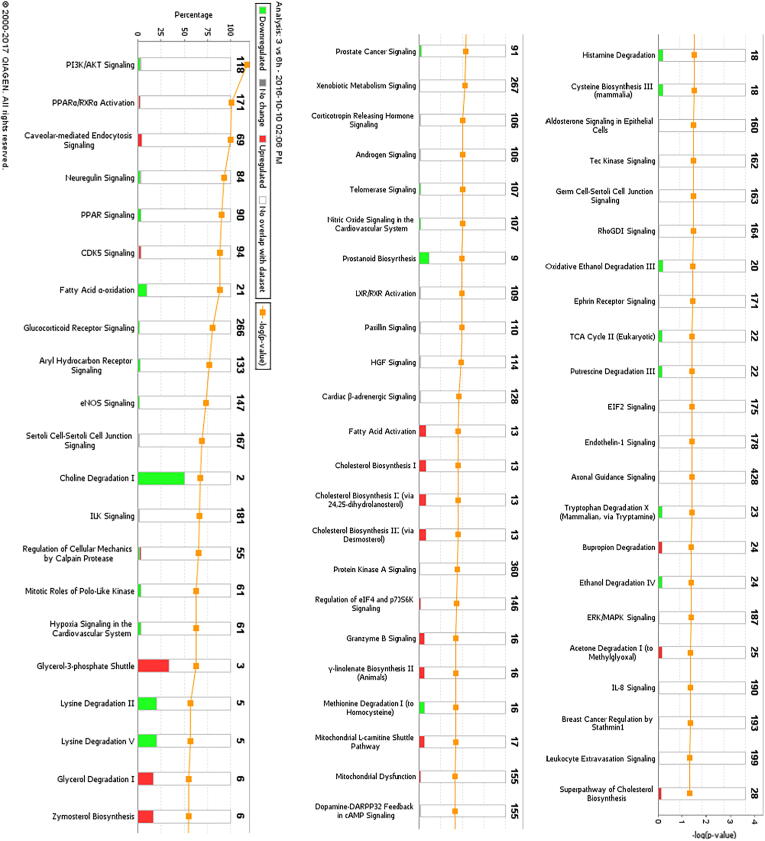
Fig. 2.
Canonical Pathway Analysis of the comparative groups in unstimulated and BK-stimulated podocytes depicting the suggested cellular mechanisms involved. (a) Top canonical pathways related to proteins altered in the Control vs 3 h BK. (b) Top canonical pathways related to proteins altered in the Control vs 6 h BK. (c) Top canonical pathways related to proteins altered in the 3 h vs 6 h BK. Bars show the total number of proteins identified in each pathway. The green color represents the downregulated proteins, and the red color represents the upregulated proteins. (For interpretation of the references to color in this figure legend, the reader is referred to the web version of this article.)


