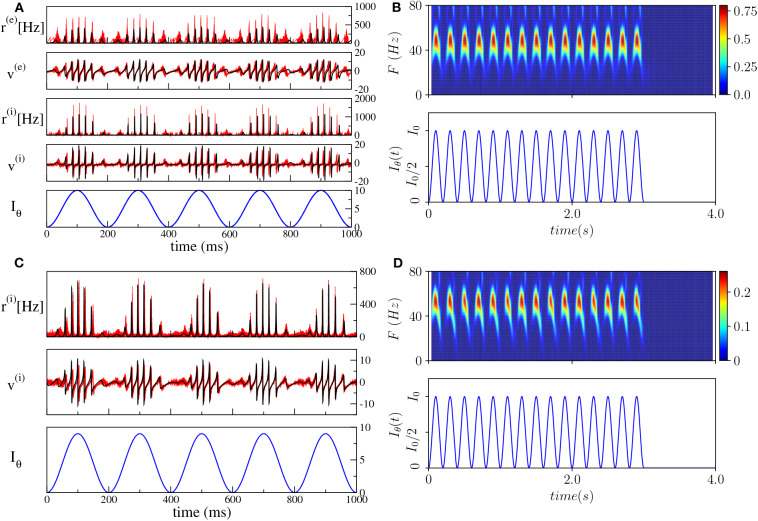
Figure 4.
Theta-nested gamma oscillations (PING set-up). (A) From top to bottom: temporal traces of r(e), v(e), r(i), v(i), for the spiking network (red curves) and the neural mass model (black curves). Iθ, reported in the bottom panel in blue, is the external current (5). For the neural mass model the average rates and membrane potentials are solutions of Equation (6), while for the network they are calculated according to Equation (4). (B) Spectrogram of the mean membrane potential v(e) (top) as a function of the external forcing (bottom). The amplitude of the forcing is I0 = 10 and its frequency is νθ = 5 Hz. Parameters of the system: J(ee) = 8, J(ie) = J(ei) = 10, J(ii) = 0, , , Δ(e) = 1, , Δ(i) = 1, , A = 0, network size N(e) = N(i) = 5, 000. The average firing rates are Hz, Hz. (ING set-up) (C) From top to bottom: temporal traces of r(i), v(i) where the line colors have the same meaning as in (A). For the neural mass model, average rates and membrane potentials are solutions of Equation (7). (D) Spectrogram of the mean membrane potential v(i) (top) as a function of the external forcing (bottom). The amplitude of the forcing is I0 = 9 and its frequency is νθ = 5 Hz. Parameters of the system: J(ii) = 21.0, , Δ(i) = 0.3, ms, τd = 10.0 ms, A = 0, system size for the purely inhibitory network N(i) = 10, 000. The corresponding average firing rate is Hz.

