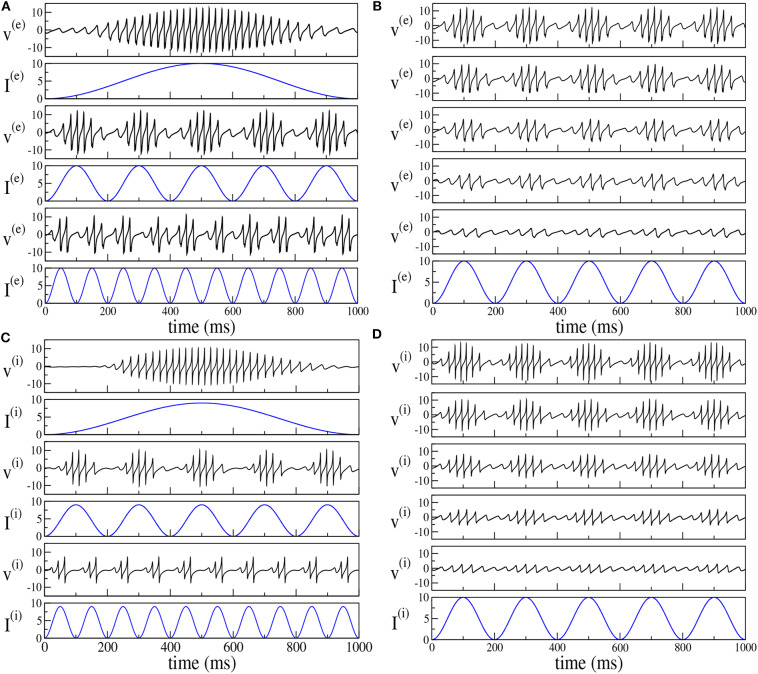
Figure 8.
Theta-nested gamma COs for PING (A,B) and ING set-up (C,D). Left column: dependence of the mean membrane potential of the excitatory (inhibitory) population v(e) (v(i)) on the frequency νθ of the external forcing () with I0 = 10 (I0 = 9) for the PING (ING) set-up. The current profiles (blue lines) are displayed immediately below the corresponding membrane potential evolution. From top to bottom, the frequency νθ is 1, 5, and 10 Hz. Right column: dependence of the mean membrane potential v(e) (v(i)) on the amplitude I0 of the external current. Here the forcing frequency is kept constant at the value νθ = 5Hz. The amplitude is changed from 100% of maximum (top) to 20% of maximum (bottom) in 20% increments, the maximum being given by I0 = 10. The data refer to the evolution of neural mass models, the parameters are the same as in Figure 4.

