
Figure 3.
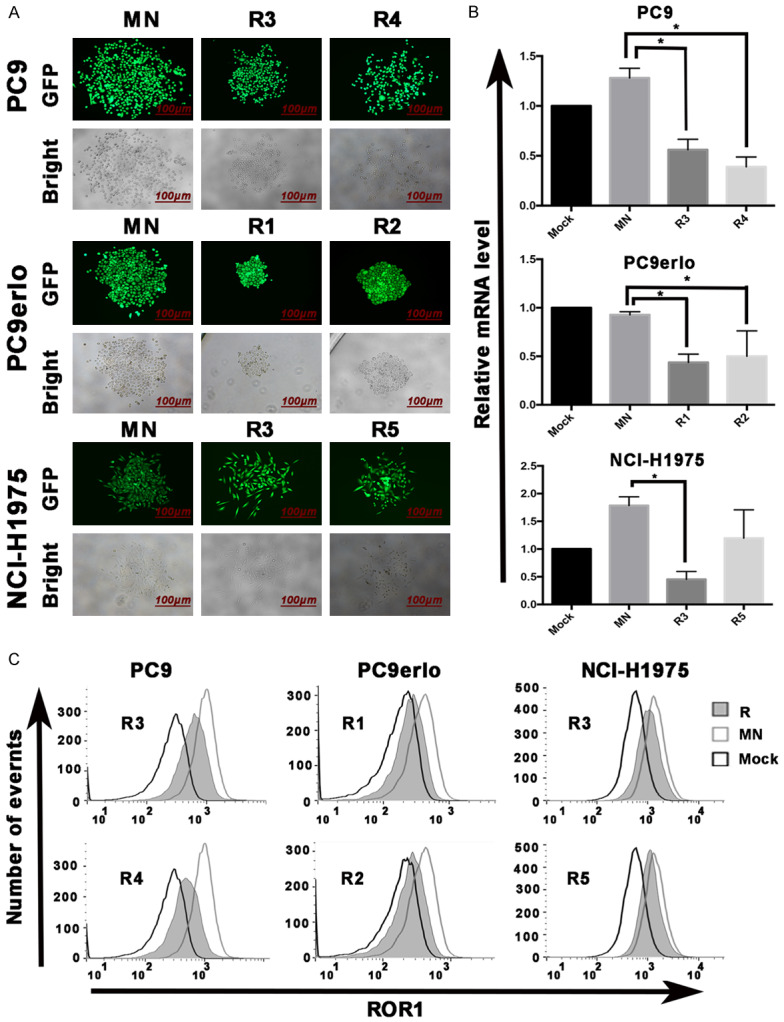
Identification of clones with ROR1 stably-silenced by RT-PCR and flow cytometry. The infection efficiency of Lv-shROR1 in selected clones (R3 and R4 from PC9, R1 and R2 from PC9erlo, R3 and R5 from NCI-H1975) was demonstrated by GFP fluorescence intensity under fluorescence microscope (A) and the relative expression levels of ROR1 were analyzed by qRT-PCR (B) and flow cytometry (C), respectively. Asterisks indicate statistically significant differences compared with the non-related shRNA group (*P<0.05). Statistical analyses was performed using one-way ANOVA (LSD method) (R3 and R4 from PC9, R1 and R2 from PC9erlo, R3 and R5 from NCI-H1975 compared with MN). Mock, cells cultured with RPMI-1640 culture medium with 10% FBS alone; MN, clones selected from cells infected with Lv-shCon; R, clones selected from cells infected with Lv-shROR1.