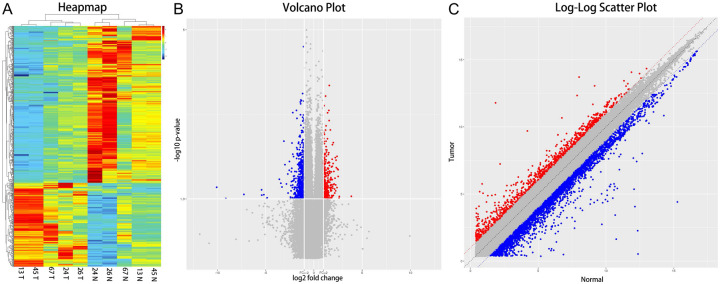
Figure 1.
Hierarchical clustering, volcano plots, and scatter plots displayed the differentially expressed circRNAs in PCA tissues compared to paracancerous tissues. A. Hierarchical clustering: numbers were the samples used for the microarray assay. T: PCA tissues, N: paracancerous tissues. B. Differentially expressed circRNAs are shown as volcano plots. The blue and red parts indicate (FC more than 2 folds) downregulated and upregulated expression circRNAs in PCA tissues, respectively (P < 0.05). C. Differentially expressed circRNAs shown by scatter plots. The green and red parts indicate (FC more than 2 folds) downregulated and upregulated expression circRNAs in PCA tissues, respectively (P < 0.05).

