
Figure 1 – Biochemical analyses of APAP metabolism and hepatotoxicity in male C57BL/6J mice.
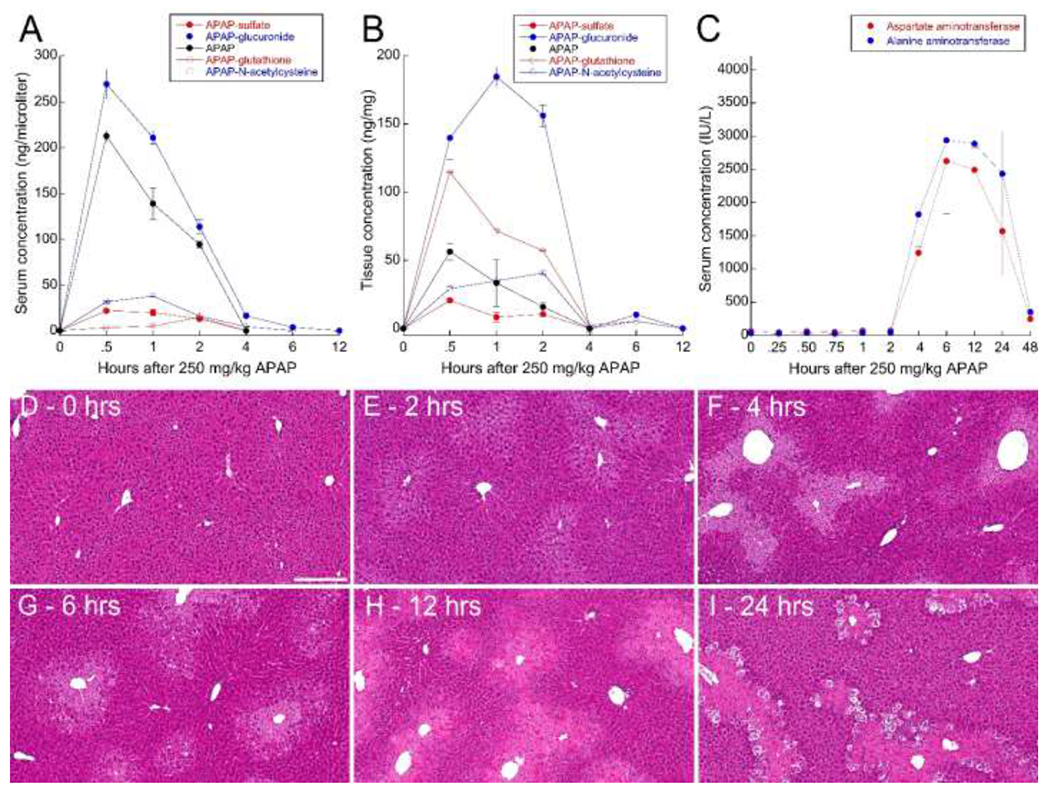
Serum (A) and liver (B) concentrations of APAP (solid black) and APAP metabolites APAP-glucuronide (solid blue), APAP-N-acetylcysteine (open blue), APAP-sulfate (solid red) and APAP-glutathione (open red). C – Serum concentrations of aspartate aminotransferase (red) and alanine aminotransferase (blue) over time after administration of 250 mg/kg APAP. Error bars represent standard errors (N=5 for all studies). D-I – Hematoxylin-eosin stained liver tissue from mice sacrificed at the indicated times after treatment with 250 mg/kg APAP. Scale bar represents length of 200 microns.