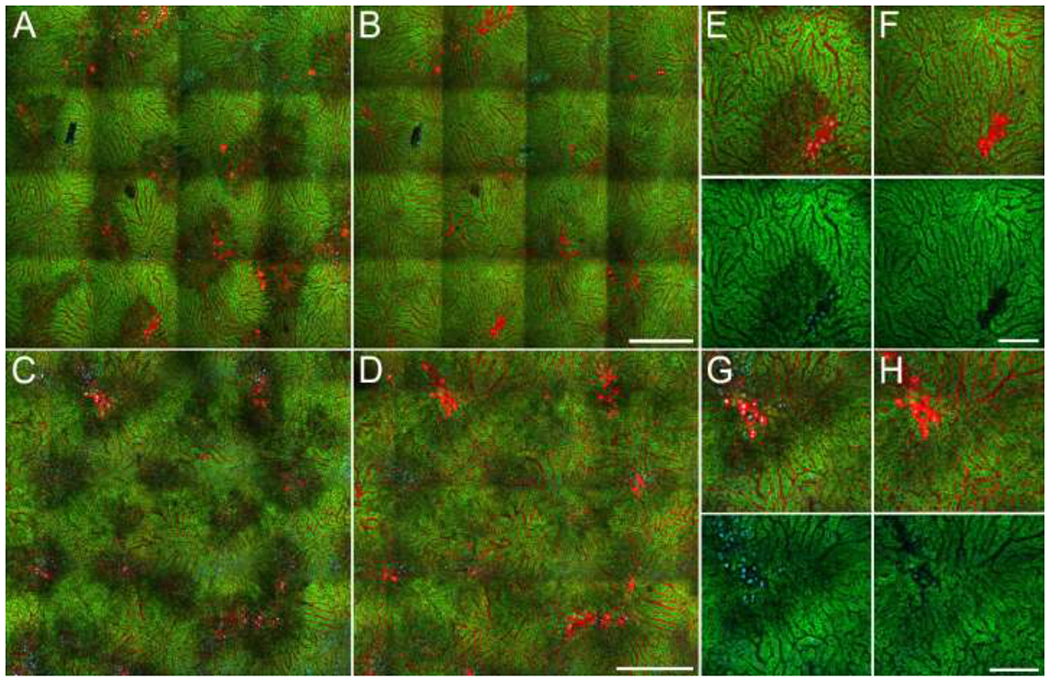
Figure 4 – Images of the livers of living mice collected sequentially over the period from 2 to 4 hours after APAP treatment.

A, C – Fields collected 2 and 2.5 hours, respectively after administration of 250 mg/kg APAP. B, D – Same fields collected 4 hours after APAP administration. E, F – Enlarged region from top left of images shown in panels A and B, respectively. G, H - Enlarged region from the top left of the images shown in panels C and D, respectively. Green levels were adjusted identically for the two time points of each study. Scale bars represent a length of 300 microns in panels A-D, and a length of 100 microns in panels E-H.
