
Figure 2. Albuminuria Remission Rates at 12 and 24 Months of Follow-up and Longitudinal Biochemical Measures of Urinary Albumin-Creatinine Ratio (uACR) and Metabolic Control.
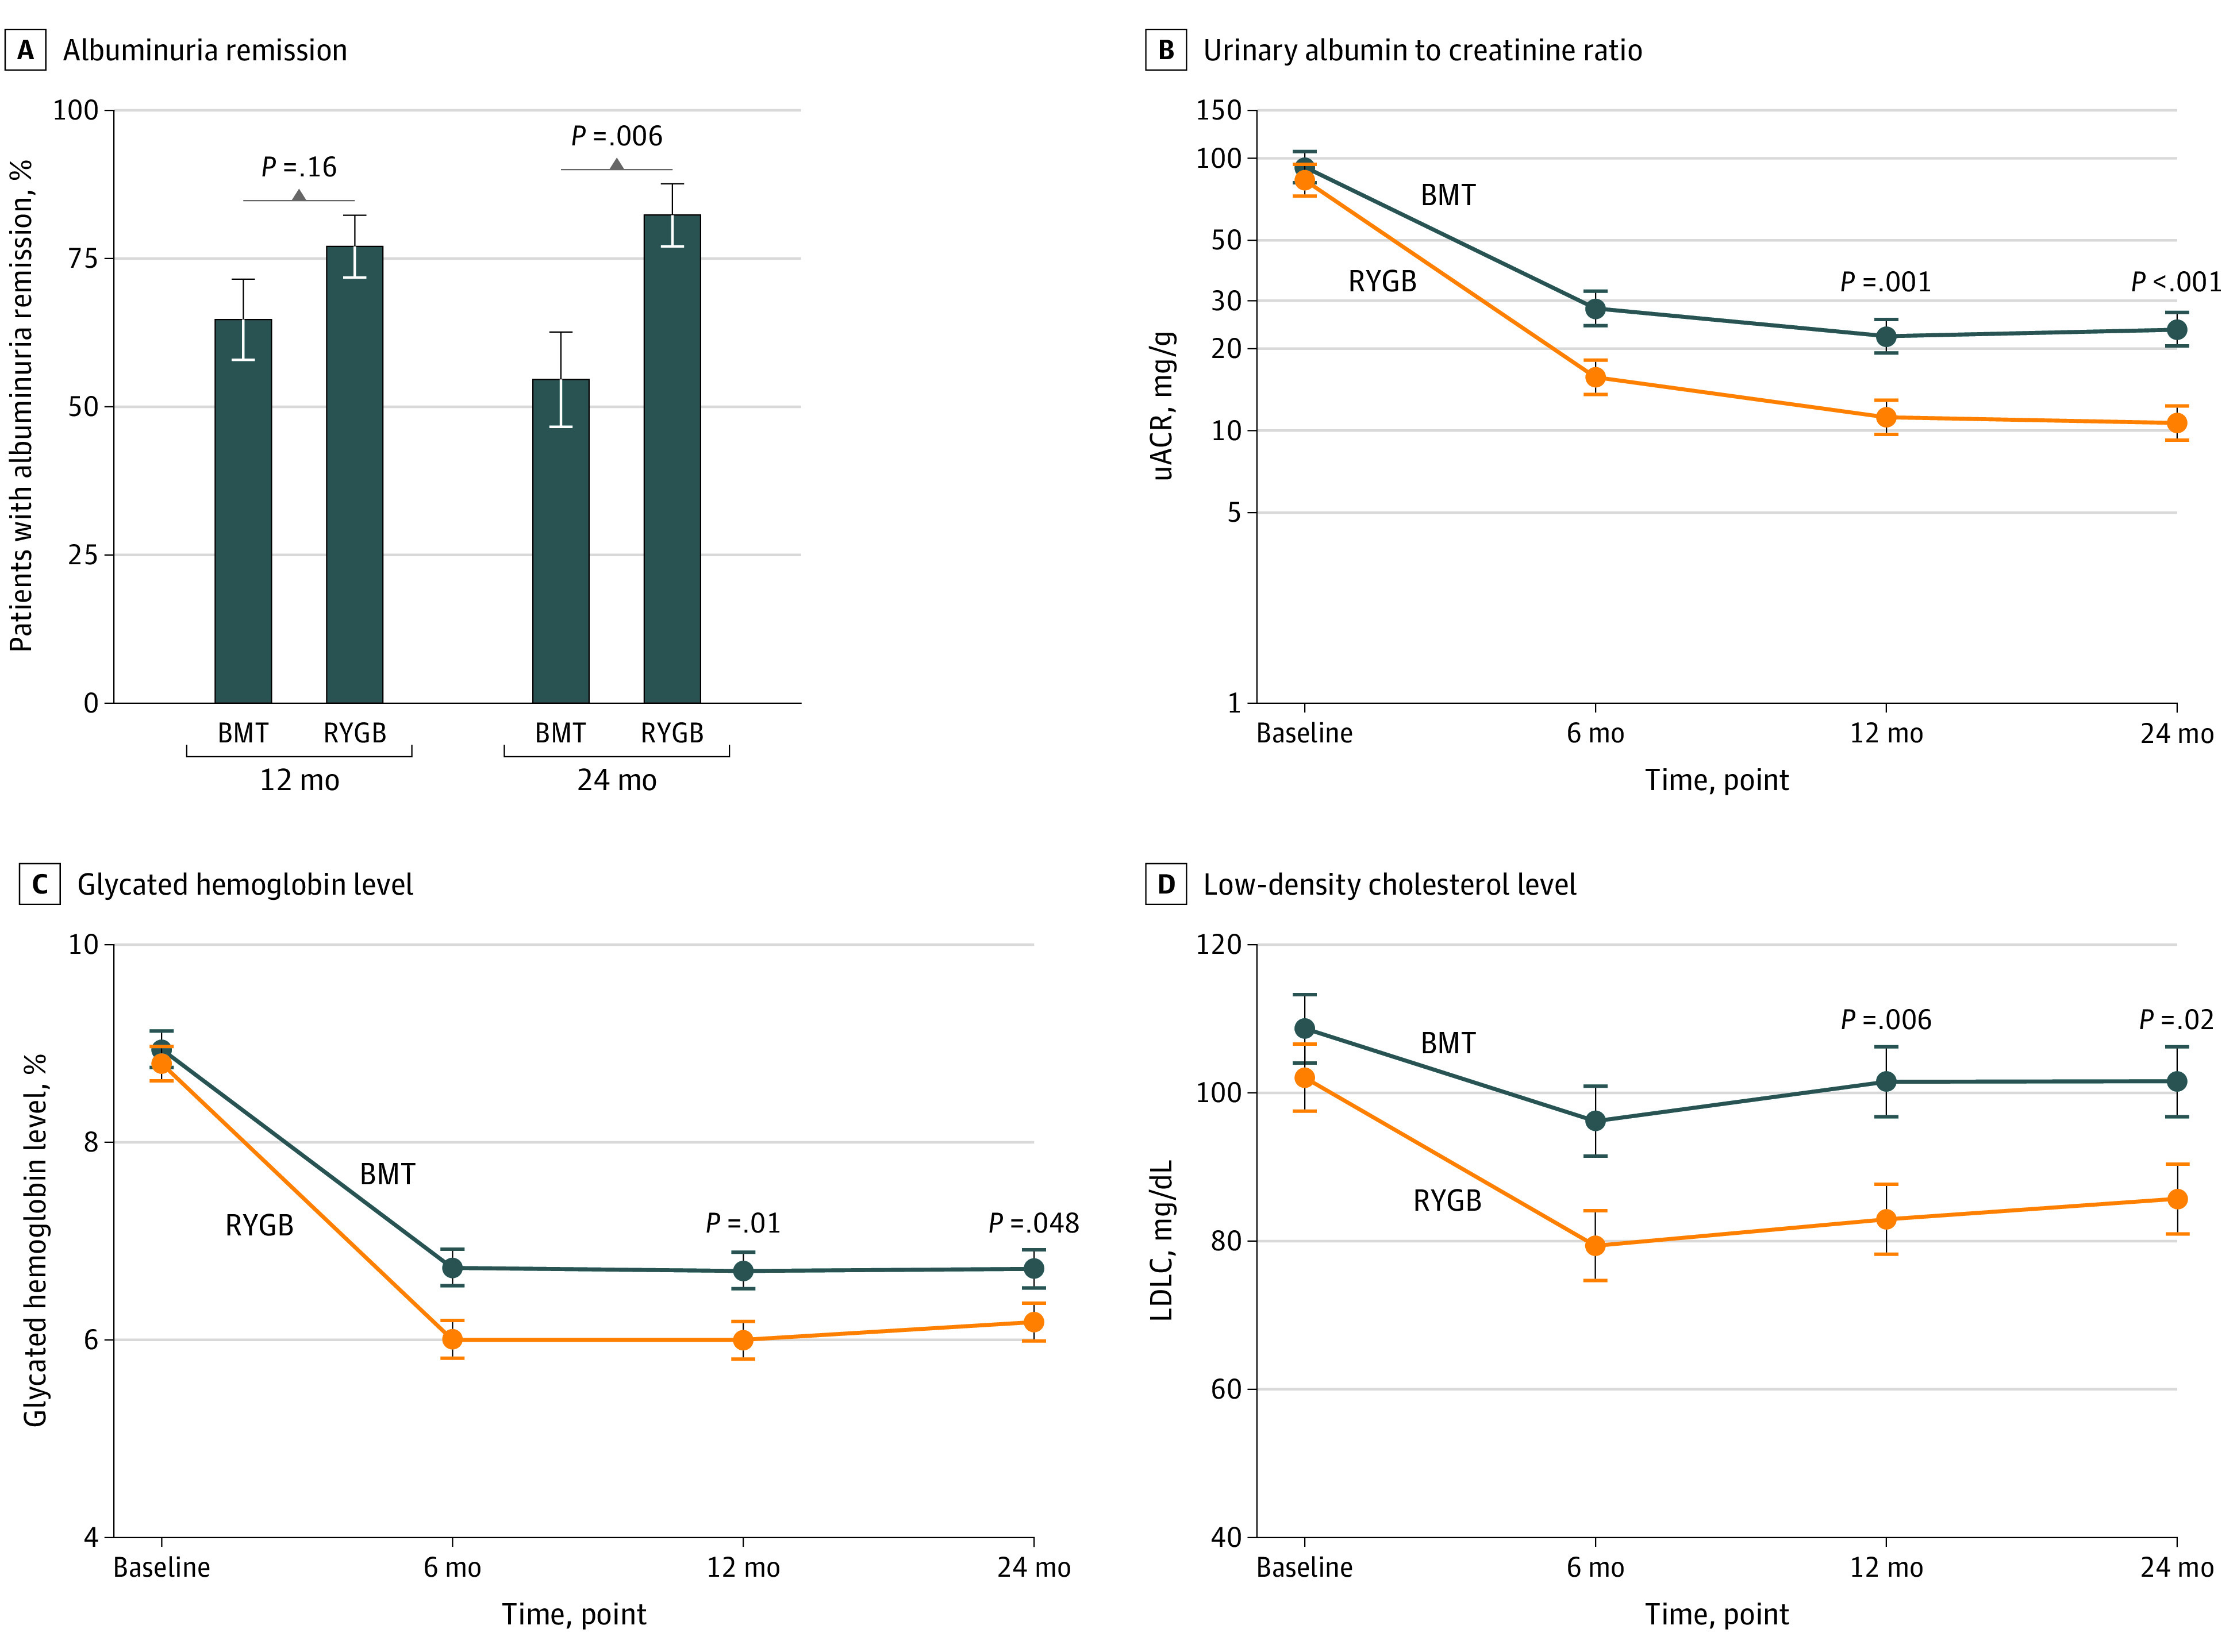
A, Rates of albuminuria remission (uACR <30 mg/g) at 12- and 24-month follow-up. B-D, Longitudinal trajectories of uACR (B), glycated hemoglobin (to convert to proportion of total hemoglobin, multiply by 0.01) (C), and low-density lipoprotein cholesterol (LDL-C) (to convert to millimoles per liter, multiply by 0.0259) (D) from baseline to 24-month follow-up. Error bars indicated SEs. BMT indicates best medical treatment; RYGB, Roux-en-Y gastric bypass.