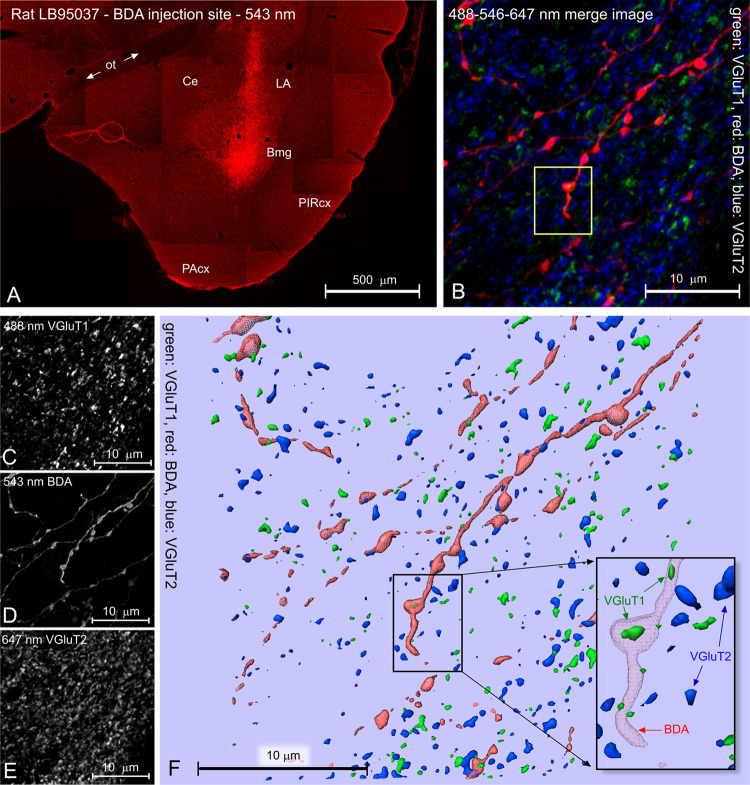
Fig. 6.
Multi-dimensional experiment. a Low-power image montage of the injection site of BDA in the basomedial nucleus of the amygdala (Bmg; rat LB95037). Ce central amygdaloid nucleus, LA lateral amygdaloid nucleus, PAcx periamygdaloid cortex, PIRcx piriform cortex, ot optic tract. b High-power imaging; sampling in striatum: Z-projection merge image of Z-stacks of images acquired at 488, 546, and 647 nm excitation in the confocal instrument. Color coding: green: VGluT1, red: BDA; blue: VGluT1. Boxed area: expression of VGluT1 inside a swelling (bouton) of a BDA-labeled fiber. c–e Z-projections of, respectively, the images acquired at 488 nm (VGluT1), 543 nm (BDA), and 647 nm (VGluT2). f 3D computer reconstruction. The inset is the fiber seen in the boxed area, frame (b). The BDA-labeled fiber (red) contains VGluT1 immunofluorescence (green) in both a bouton and in the fiber shaft (arrows). Notice that there is no colocalization of VGluT1 and VGluT2

