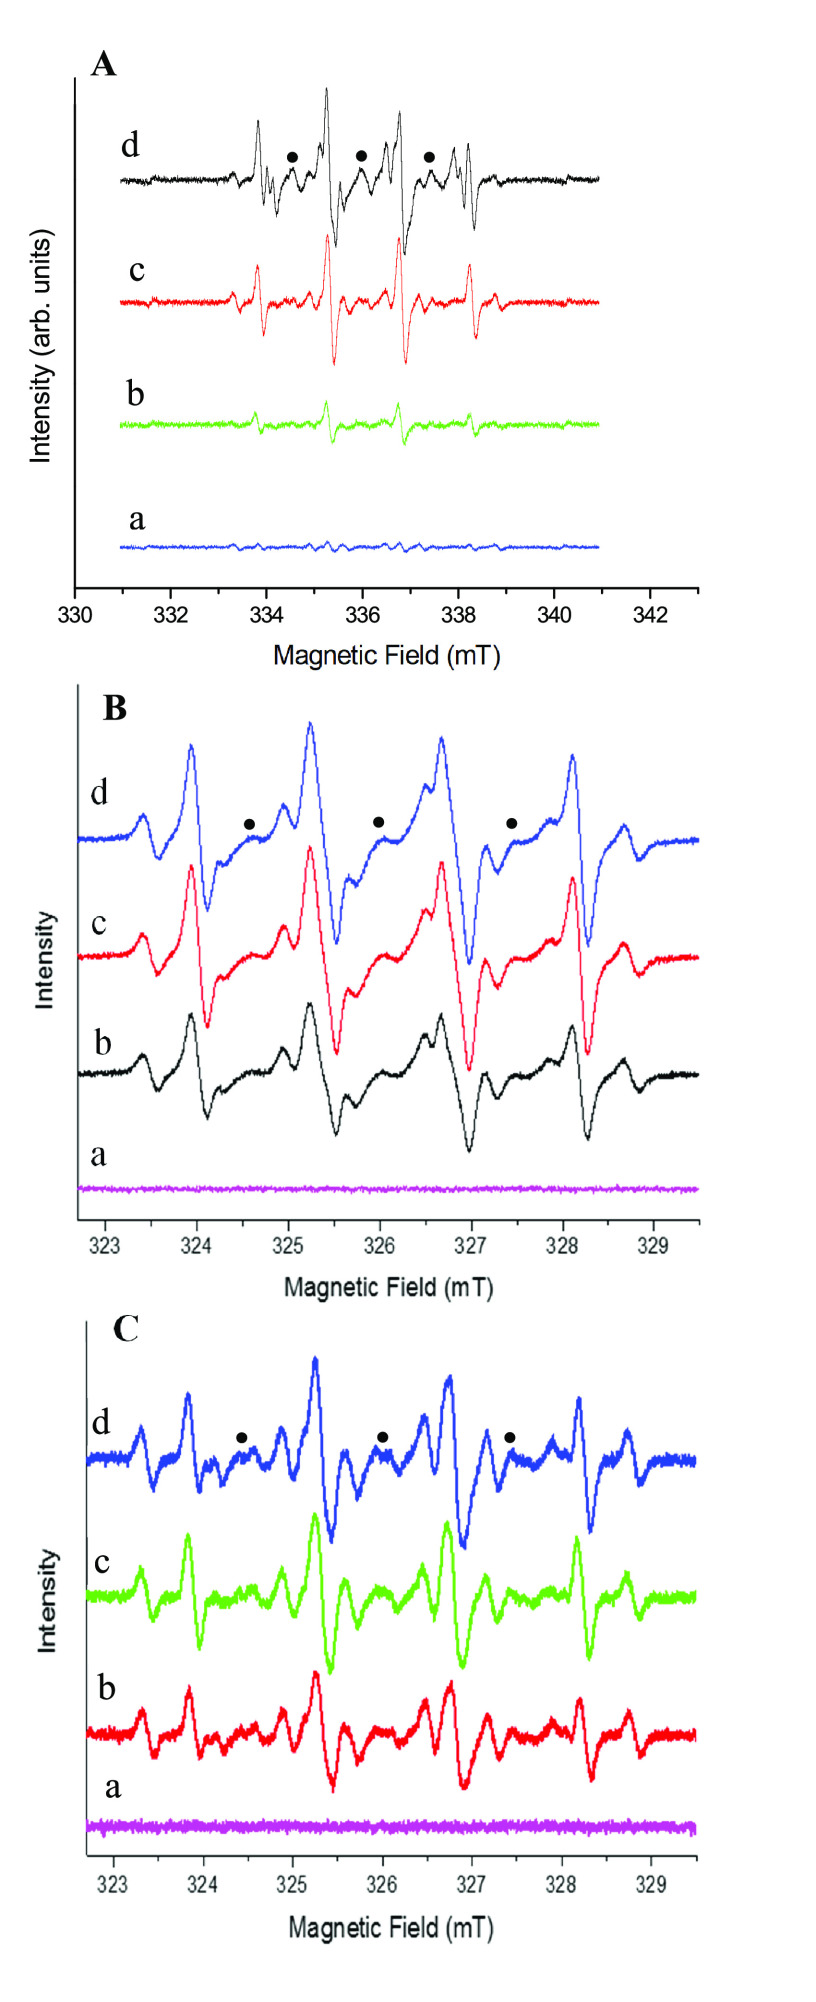
Figure 5.
Experimental EPR spectra recorded at room temperature after the reaction of cerium oxide NSs with H2O2 in the presence of DMPO spin trap. (The nitroxide degradation product of the spin trap is indicated by black dots.) EPR spectrum of the liquid phase separated from the (A) cerium oxide NSs at varying pH: (a) control (without cerium oxide NSs), (b) pH = 11, (c) pH = 7.0, and (d) pH = 3; (B) various cerium oxide NS concentrations: (a) 0 mg·mL–1, (b) 4 mg·mL–1, (c) 8 mg·mL–1, and (d) 12 mg·mL–1; and (C) various H2O2 concentrations: (a) 0%, (b) 4%, (c) 8%, and (d) 12%.

