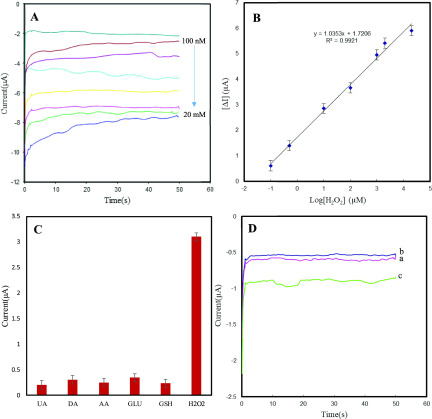
Figure 8.
(A) Chronoamperometric responses of Au electrode/cerium oxide upon addition of different H2O2 concentrations. Applied potential: −0.5 V. (B) Logarithmic relationship between the concentrations of H2O2 (0.1, 0.5, 10, 100, 1000, 2000, and 20 000 μM). (C) Interference studies of cerium oxide-based lab-on-a-chip device on addition of 1 mM UA, DA, AA, GLU, GSH and 0.2 mM H2O2. (D) Chronoamperometric responses of Au electrode/cerium oxide for the reduction of H2O2 released from 106 PC 12 cells in 1 mL of 1 × PBS (pH = 7.4): (a) PC12 cells, (b) AA (4 μM), and (c) PC12 cells upon injection of 4 μM AA.

