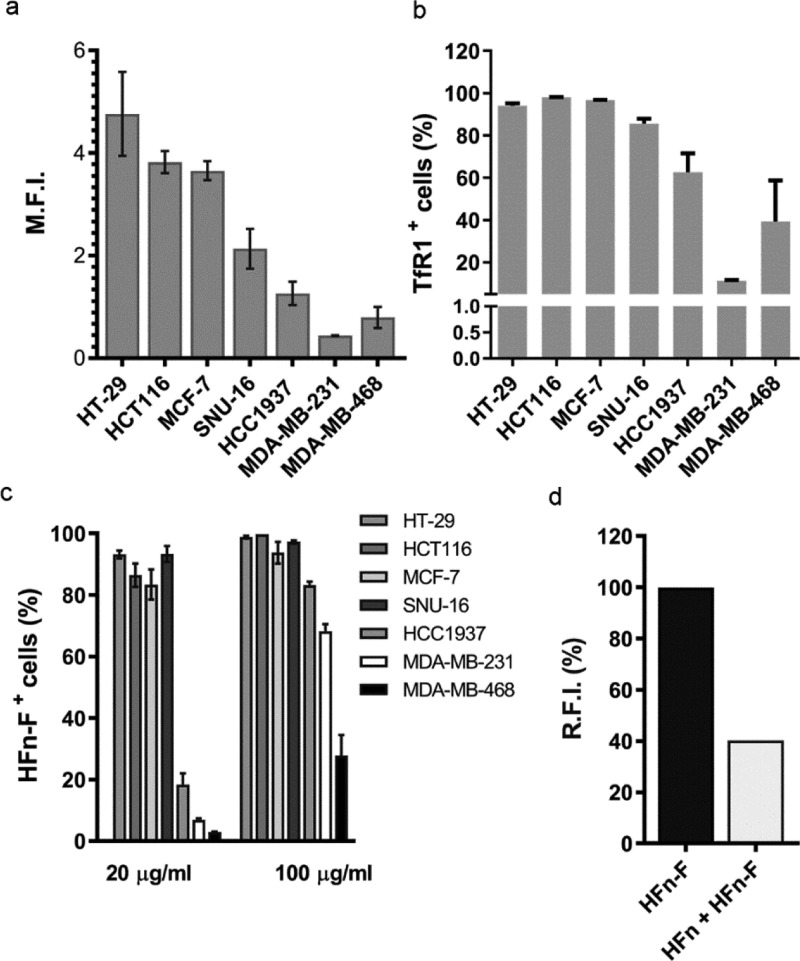
Figure 1.
HFn specific interaction with CC lines. TfR1 expression of CC lines tested by cytofluorimetry expressed as mean fluorescence intensity (a) and as percentage of positive cells (b). Cells immunodecorated with the anti-mouse secondary antibody conjugated with Alexa Fluor 488 were used to set the gate on viable cells, on singlets, and the region of positivity. (c) HFn–F binding with CCs. Cells were incubated 2 h at 4 °C in PBS buffer and 0.3% BSA with different amounts of HFn–F (20 and 100 μg/mL). Cells were processed for flow cytometry using untreated cells to set the positive region and the singlet gate. (d) Competition assay in HT-29 cells (high TfR1 expression) incubated with 500 μL of HFn–F (20 μg/mL) at 4 °C for 2 h with or without an excess of unlabeled HFn (1 mg/mL) as competitor. Cells were then detached and treated for flow cytometry. Untreated cells have been used to set the singlet gate and the positive region. Data are reported as average ± S.D. of three independent experiments and expressed as panel (a), mean fluorescence intensity (M.F.I., ×105); panel (b), percentage of cells in the positive region to HFn–F fluorescence and; panel (c), relative fluorescence intensity (R.F.I., %).

