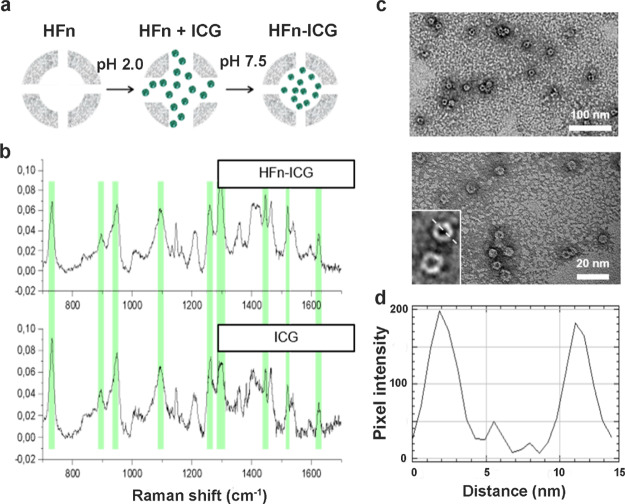
Figure 2.
Development and characterization of ICG-loaded HFn nanocages. (a) Schematic representation of the pH-dependent disassembly/reassembly method used for HFn loading with ICG. ICG is represented in green and HFn is represented in gray. (b) Raman characterization of HFn–ICG nanoformulation; the peaks of free ICG (green highlights) are also found in HFn–ICG samples, meaning that the dye was efficiently loaded within the nanoformulation. (c) TEM images of HFn–ICG at different magnifications and (d) a representative profile plot confirming the size of the nanoassembly, with an inner and outer shells of approximately 8 and 12 nm, respectively.

