Figure 5.
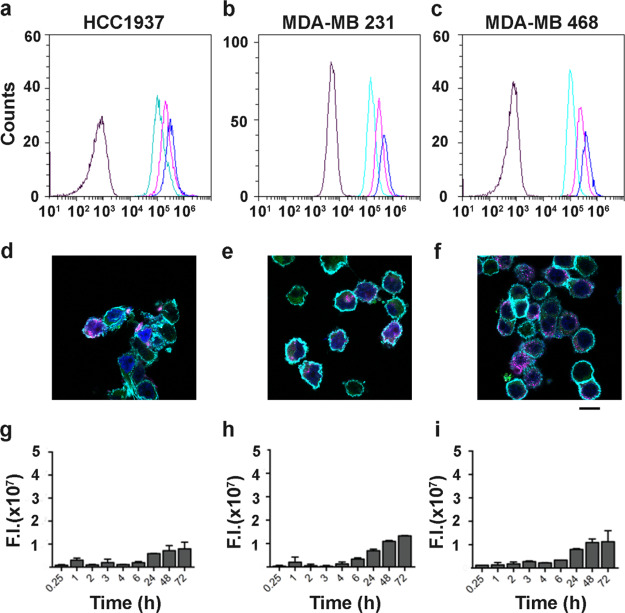
HFn–ICG interaction with TfR1low CCs. (a–c) Representative flow cytometry plots showing cell binding with 20, 50, and 100 μg/mL of HFn–ICG (light green, purple, and blue curves, respectively, black curves = control cells) after 2 h incubation at 4 °C. (d–f) Representative confocal microscopy images of cells incubated with HFn–ICG for 2 h at 4 °C to evaluate binding and TfR1 colocalization (blue = cell nuclei stained with DAPI, cyan = cell membranes, green = HFn–ICG, and purple = αTfR1 antibody staining). (g–i) Cellular uptake of HFn–ICG evaluated by IVIS analysis, after incubation at 37 °C for different time points. Low TfR1 expressions lead to low binding, low uptake, and low colocalization with TfR1.

