Fig. 6.
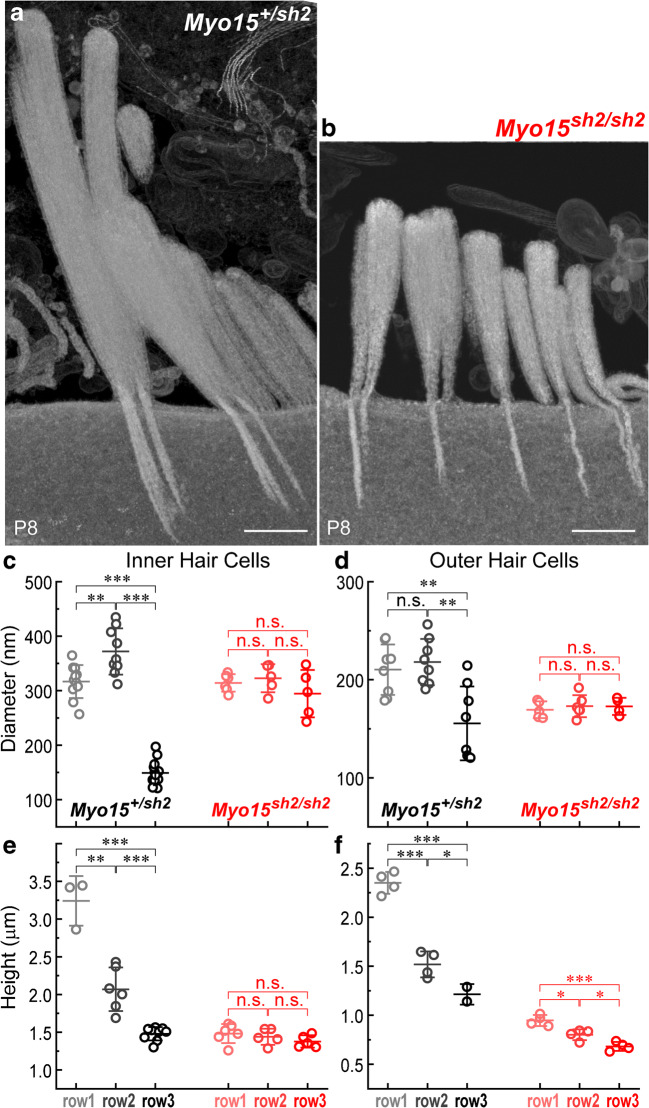
Reorganization of stereocilia actin core in Myo15sh2/sh2 mice. a, b Reconstruction of the longitudinal views of stereocilia bundles in the IHCs of Myo15+/sh2 (a) and Myo15sh2/sh2 (b) mice from 20-nm-thick FIB-SEM serial sections. Scale bars: 500 nm. c–f Quantification of stereocilia diameters (c, d) and heights (e, f) from 3D FIB-SEM stacks of images of IHC (c–e) and OHC (d–f) bundles. Each data point represents one stereocilium in the first, second, or third stereocilia rows of the bundle (shown in different shades of gray for Myo15+/sh2 stereocilia or different shades of red for Myo15sh2/sh2 stereocilia). All measured stereocilia were located in the middle of the bundle (excluding at least three stereocilia at the edges of each stereocilia row). Mean values ± SD are also shown. Asterisks indicate significance of the differences (t test of independent variables: n.s., non-significant; *P < 0.05; **P < 0.01; ***P < 0.001). All cells were located in the middle of the cochlea of P8 mice. Because sample preparation and serial sectioning with FIB-SEM is still a labor- and time-consuming procedure, serial sections of only one bundle per hair cell type/genotype were obtained (except two control IHCs)

