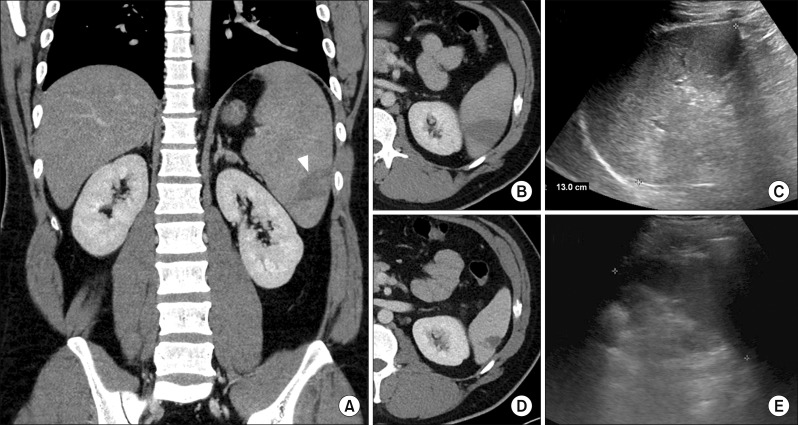
Fig. 1.
Serial follow-up image studies of the patient. (A) Initial: hepatomegaly and splenomegaly with focal splenic infarction (white wedge), (B) Initial: focal low attenuation density at spleen, (C) HOD 15: decreased spleen size to upper limit of normal, (D) HOD 30: decreased pathologic lesion compared to initial image, (E) HOD 60: decreased spleen size to normal range.

